It’s 2 AM. Your monitoring dashboard shows everything green. CPU usage: normal. Memory: stable. Response times: within acceptable limits. Yet your phone won’t stop buzzing with alerts. Users can’t complete checkout. Your API is timing out. Revenue is dropping.
You’re staring at graphs that tell you what is broken, but give you zero insight into why.
This is the moment when many engineering teams realize that monitoring alone isn’t enough anymore.
The shift from monoliths to microservices, from bare metal to Kubernetes, from predictable load patterns to chaotic real-world traffic has fundamentally changed how we build and operate software. Traditional monitoring was designed for a simpler era. It tells you when things go wrong, but modern systems are too complex, too distributed, and too dynamic for monitoring to answer the questions that actually matter during an incident.
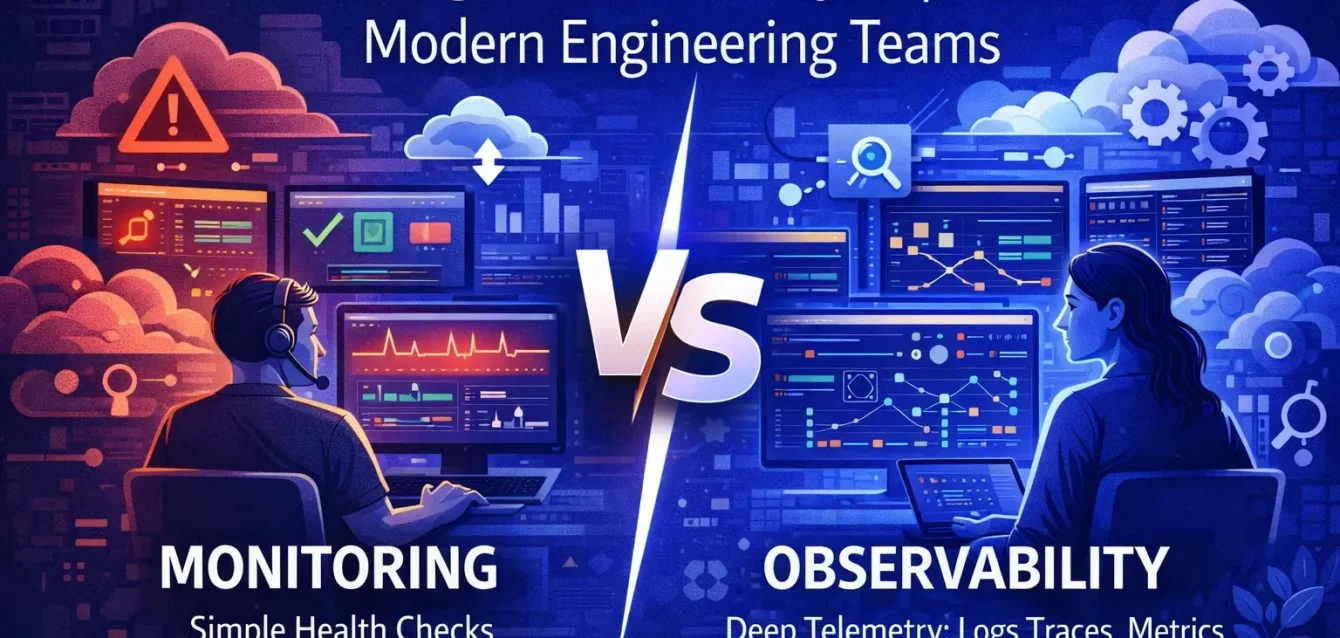
This is where observability comes in—not as a replacement for monitoring, but as a different approach to understanding system behavior. In this post, we’ll break down what monitoring and observability actually mean, why the distinction matters, and how they work together to help you build reliable systems at scale.
What is Monitoring?
Monitoring is the practice of collecting, aggregating, and analyzing predefined metrics to track the health and performance of your systems. It’s about watching known signals and alerting when they cross defined thresholds.
Think of monitoring as your system’s vital signs. Just like a heart rate monitor in a hospital, it tracks specific measurements over time:
- CPU and memory utilization
- Request rates and throughput
- Error rates and status codes
- Disk I/O and network traffic
- Application-specific metrics (database query times, cache hit rates, queue lengths)
Monitoring operates on a simple premise: if you know what “good” looks like, you can detect when things deviate from normal. You set thresholds—CPU shouldn’t exceed 80%, error rate should stay below 0.5%, response time should be under 200ms—and you get alerted when those boundaries are crossed.
Common monitoring tools include:
- Prometheus and Grafana for metrics collection and visualization
- Datadog, New Relic, or CloudWatch for cloud infrastructure monitoring
- Nagios or Zabbix for traditional infrastructure monitoring
- PagerDuty or Opsgenie for alert management
What monitoring does well:
- Detects known failure modes quickly
- Tracks system health trends over time
- Provides operational awareness at a glance
- Enables capacity planning through historical data
- Works great for stable, predictable systems
Where monitoring falls short:
Monitoring is fundamentally reactive and assumption-based. You need to know what to measure ahead of time. You need to predict which metrics matter and which thresholds indicate problems. This works when your system architecture is simple and failure modes are well-understood.
But what happens when you don’t know what question to ask? What happens when the problem is an emergent behavior caused by the interaction between twelve microservices, each behaving normally on its own? What happens when your error rate is “normal” but users are experiencing random 10-second delays?
This is where monitoring shows its limits in modern, distributed systems.
What is Observability?
Observability is the ability to understand the internal state of your system based on the outputs it produces. Instead of asking “Is this metric above threshold?”, observability asks “Why is the system behaving this way?”
The concept comes from control theory: a system is observable if you can determine its internal state by examining its outputs. In software engineering, this means you can ask arbitrary questions about your system’s behavior without having to predict those questions in advance.
Observability is built on three pillars:
- Logs: Timestamped records of discrete events (errors, warnings, state changes, user actions)
- Metrics: Numerical measurements aggregated over time (request counts, latency percentiles, resource usage)
- Traces: Records of how requests flow through distributed services (showing the complete path and timing of each operation)
But observability is more than just collecting these three data types. It’s about the relationships between them. It’s about context, correlation, and the ability to slice and filter data in ways you never anticipated needing.
What makes a system observable:
- High-cardinality data: The ability to filter by any attribute (user ID, session ID, deployment version, geographic region, device type)
- Rich context: Every piece of telemetry carries metadata about what was happening when it was generated
- Correlation across signals: Connect a slow trace to relevant logs to specific metrics
- Open-ended queries: Ask new questions without deploying new instrumentation
Modern observability tools include:
- Honeycomb, Lightstep, or Datadog APM for full observability platforms
- Jaeger or Tempo for distributed tracing
- Elastic Stack (ELK) or Loki for log aggregation
- OpenTelemetry for standardized instrumentation
The key difference: observability assumes you don’t know what will break or how. It’s designed for exploration, investigation, and understanding emergent behaviors in complex systems.
Monitoring vs Observability: Side-by-Side Comparison
| Aspect | Monitoring | Observability |
|---|---|---|
| Primary Purpose | Detect known problems | Investigate unknown problems |
| Questions Answered | “Is something wrong?” “What is broken?” | “Why is it broken?” “What caused this behavior?” |
| Approach | Reactive, threshold-based | Proactive, exploratory |
| Data Requirements | Predefined metrics and dashboards | High-cardinality, contextual data |
| Best For | Known failure modes, health checks, SLO tracking | Root cause analysis, debugging novel issues |
| Mental Model | “Tell me when X goes above Y” | “Help me understand what’s happening” |
| Instrumentation | Specific counters and gauges | Rich, structured telemetry with context |
| Typical Limitations | Can’t answer questions you didn’t anticipate | Requires more sophisticated tooling and instrumentation |
| System Requirements | Works with any system | Requires observable system design |
| Outcome | “Something is wrong with the payment service” | “User ID 12345’s checkout failed because the shipping API timed out waiting for the inventory service, which was experiencing connection pool exhaustion” |
Why Monitoring Alone Breaks in Modern Systems
A decade ago, most applications were monoliths running on a handful of servers. You could SSH into a box, tail a log file, and understand what was happening. Monitoring was enough because the system was simple enough to understand.
Today’s reality looks nothing like that.
Modern distributed systems are fundamentally different:
Microservices everywhere: A single user request might touch 20+ services. When something breaks, which service caused it? Traditional monitoring shows you that multiple services are reporting errors, but can’t tell you the chain of causation.
Ephemeral infrastructure: Containers and pods are constantly being created and destroyed. By the time your alert fires, the problematic container might already be gone. Static dashboards can’t keep up with infrastructure that changes every few minutes.
Dynamic scaling: Auto-scaling means your baseline metrics are constantly shifting. What’s “normal” at 10 AM with 50 pods looks nothing like 2 PM with 200 pods. Fixed thresholds become meaningless.
Async and event-driven architectures: When services communicate through message queues, Kafka streams, or event buses, request flows become non-linear. A user action at 3:00 PM might trigger background processing at 3:05 PM that fails at 3:10 PM. Traditional request/response monitoring can’t trace this.
Emergent complexity: The most interesting failures in distributed systems aren’t caused by a single component failing. They’re caused by subtle interactions: a retry storm amplifying a small performance degradation, a cascade failure triggered by connection pool exhaustion, or a memory leak in one service causing downstream timeout increases.
Here’s what happens with monitoring-only approaches:
You get an alert: “Payment Service Error Rate Above Threshold.” You look at your dashboard. CPU is fine. Memory is fine. Error rate is up, but the logs show generic 500 errors. You can see that something is wrong, but you have no path to understanding why. You start guessing: “Maybe it’s the database?” “Could it be the Redis cache?” “Did the latest deployment break something?”
Each hypothesis requires deploying new monitoring, waiting for the problem to happen again, or digging through raw logs manually. By the time you figure it out, you’ve lost hours of incident response time and potentially significant revenue.
This is why monitoring alone isn’t enough anymore. The systems we build are too complex for predetermined dashboards and threshold alerts.
How Observability Changes Incident Response
Observability fundamentally transforms how teams respond to production incidents by enabling investigation-driven debugging rather than hypothesis-driven troubleshooting.
The monitoring approach:
- Alert fires: “API latency is high”
- Check dashboard: CPU normal, memory normal
- Form hypothesis: “Maybe it’s the database?”
- Check database metrics: Query time looks normal
- New hypothesis: “Maybe it’s a network issue?”
- Check network metrics: Nothing obvious
- Repeat until you get lucky or the issue resolves itself
The observability approach:
- Alert fires: “API latency is high”
- Filter traces by high latency (>2 seconds)
- See that 80% are checkout requests from users in EU region
- Drill into a specific slow trace
- See that 1.8 seconds are spent in the payment service
- See that payment service is waiting on shipping calculation
- See that shipping service is making 50+ calls to an external rate-checking API
- Root cause found: External API degradation causing retry storms
Real-world examples:
Example 1: The Mysterious Slow Checkout Your monitoring shows normal error rates but customer complaints are spiking. With observability, you can filter traces by “checkout” AND “latency > 3s” AND “user_region = US-West”. You discover that only users selecting “same-day delivery” are affected. Tracing shows the inventory service is timing out, but only for a specific warehouse. You identify a database connection pool leak introduced in yesterday’s deployment—but only affecting one of 50 microservices, only for certain request patterns.
Example 2: The Silent Data Loss No alerts are firing. Error rates are normal. But after an incident, you discover some customer updates weren’t saved. With observability, you can query: “Show me all traces where user_action = ‘profile_update’ AND response_status = 200 BUT event_published = false.” You find that a Kafka producer was silently dropping messages when the topic was full—returning success to the API but never actually publishing the event.
Example 3: The Cascade Failure Multiple services start reporting errors simultaneously. Your monitoring dashboards are a sea of red, but no single service looks like the root cause. With distributed tracing, you can see that a small latency increase in the auth service (from 50ms to 200ms) caused downstream services to hit their 500ms timeouts, which triggered retries, which amplified the load, which caused the auth service to slow down further—a classic cascade failure invisible to service-level metrics alone.
Observability gives you the ability to ask: “Show me all traces where this happened” rather than “I think this metric might be related, let me check.”
Real-World Example: From Alert to Resolution
Let’s walk through a concrete scenario that illustrates the difference in practice.
The Alert: At 2:47 PM, PagerDuty fires: “Order Service: Error rate above 5% threshold.”
Monitoring tells you:
- Order service error rate: 8.2%
- Order service p95 latency: 450ms (normal)
- Order service CPU: 45% (normal)
- Order service memory: 62% (normal)
- Database query time: 120ms average (normal)
You’re stuck. Everything looks fine except the error rate itself. You could start randomly checking dependencies, but there are 12 of them.
Observability shows you:
You open your observability platform and filter traces:
service = order-servicestatus = errortimestamp > last_15_minutes
You see 847 failed traces. You group them by error type and notice 95% are showing “InventoryServiceException: Connection timeout.”
You click into a sample trace and see the full request flow:
- User submits order (0ms)
- Order service validates request (5ms)
- Order service calls inventory service (10ms)
- Inventory service starts processing (11ms)
- Inventory service queries database (12ms – 3,015ms) ← Problem here
- Database query times out (3,015ms)
- Inventory service returns 500 error (3,020ms)
- Order service catches exception and returns error to user (3,025ms)
Now you look at inventory service traces specifically. You filter for database.query.duration > 2000ms and see they’re all hitting the same database table: inventory_reservations.
You check the inventory service’s recent deployments and see a release 20 minutes ago. You examine the diff and find that a new feature added a query without a proper index on the reservation_status column. The table has 50 million rows. The full table scan is taking 3+ seconds.
Time to root cause: 4 minutes.
You roll back the deployment, add the index, and redeploy. Errors drop to zero within 2 minutes.
Without observability, this could have taken hours of checking logs, SSH-ing into containers, and manually correlating data across services.
Do You Need Both?
The short answer: yes, absolutely.
Monitoring and observability are complementary, not competing approaches. They solve different problems and work best together.
Monitoring is essential for:
- Alerting you when something goes wrong
- Tracking SLIs and SLOs
- High-level health dashboards
- Capacity planning and trend analysis
- Compliance and reporting
- Quick health checks during deployments
Observability is essential for:
- Understanding why alerts are firing
- Debugging novel or complex issues
- Root cause analysis during incidents
- Validating hypotheses about system behavior
- Understanding user experience and impact
- Continuous improvement and learning
How they work together:
Think of monitoring as your smoke detector and observability as your investigation toolkit. The smoke detector tells you there’s a fire somewhere in the house. Your investigation toolkit (flashlight, thermal camera, inspection tools) helps you find exactly where it started, why it started, and how to prevent it in the future.
In practice:
- Monitoring alerts you that error rates are elevated
- Observability helps you trace those errors to their root cause
- Monitoring confirms that your fix worked and error rates have returned to normal
A mature engineering organization has both robust monitoring for known failure modes and comprehensive observability for investigating the unknown. You’ll use monitoring every day for operational awareness. You’ll use observability every time something unexpected happens—which, in complex distributed systems, is often.
Key Takeaways
- Monitoring tells you what is broken; observability tells you why it’s broken
- Monitoring works with predefined metrics and thresholds; observability enables open-ended investigation through high-cardinality data
- Monitoring is sufficient for simple, stable systems; observability is necessary for distributed, dynamic architectures
- Modern systems are too complex for monitoring alone—microservices, containers, auto-scaling, and async architectures create emergent behaviors that can’t be predicted with fixed dashboards
- Observability transforms incident response from guesswork to investigation, dramatically reducing mean time to resolution
- You need both: Monitoring for alerting and trend tracking, observability for debugging and understanding
- Observability requires investment: In instrumentation, tooling, and mindset—but the ROI during incidents is massive
The Path Forward
Observability isn’t a luxury anymore—it’s becoming table stakes for engineering teams operating at scale. As systems grow more distributed and complex, the gap between “we got an alert” and “we understand the problem” grows wider.
The teams winning in this environment aren’t the ones with the most monitoring dashboards. They’re the ones who can ask new questions about their systems without deploying new code. They’re the ones who can trace a user complaint to a specific interaction between services. They’re the ones who can debug production issues in minutes instead of hours.
If you’re still relying on monitoring alone, you’re fighting modern production challenges with legacy tools. Start small: add distributed tracing to your critical paths. Instrument your code with rich context. Build the muscle of asking “why” instead of just watching metrics.
Your future self, responding to a 3 AM incident, will thank you.
The systems we build will only get more complex. The question isn’t whether to adopt observability—it’s how quickly you can make it a core part of your engineering practice.


