Running Kubernetes in production means dealing with a flood of signals from every direction—metrics from Prometheus, logs scattered across pods, traces from your service mesh, and alerts firing from three different systems. When something breaks at 2 AM, the last thing you want is to spend 20 minutes correlating data across disconnected tools before you even understand the problem.
Unified observability solves this by consolidating metrics, logs, and traces into a single platform where data connects automatically. This guide covers what unified observability actually means, how it differs from traditional monitoring, the tools that make it work, and a practical path to implementing it across your Kubernetes clusters.
What is unified observability for Kubernetes?
Unified observability for Kubernetes consolidates metrics, logs, and traces into a single platform that gives you complete visibility across your entire cluster. Instead of jumping between Prometheus for metrics, Elasticsearch for logs, and Jaeger for traces, you get one place where all your telemetry data connects automatically.
The word “unified” is doing real work here. It’s not just about having all your data in one dashboard. It’s about correlation—linking a spike in CPU usage to the specific log entries and request traces that explain why it happened. That connection is what turns raw data into actual insight.
Why does this matter so much for Kubernetes specifically?
Kubernetes is constantly changing. Pods spin up and disappear. Services scale automatically. Workloads shift between nodes. A unified platform tracks all of this movement across every observability pillar at once, so you’re never piecing together a puzzle with missing pieces.
The three pillars of Kubernetes observability
Observability rests on three foundational data types, each of which captures something different about your cluster. Together, they give you the full picture. Separately, they leave gaps.
1. Kubernetes Metrics
Metrics are numerical measurements collected at regular intervals—CPU usage, memory consumption, request latency, error rates, pod counts. Think of them as the vital signs of your cluster.
Metrics answer questions about trends and thresholds. Is latency creeping up? Are you approaching resource limits? Is traffic growing faster than capacity? Prometheus has become the go-to tool for Kubernetes metrics because of its native service discovery and powerful query language.
2. Kubernetes Logs
Logs are timestamped records of discrete events. Every application output, error message, and system notification gets captured as a log entry with a timestamp attached.
When something breaks, logs provide the context that metrics can’t. They capture the actual error messages, stack traces, and application state that tell you what went wrong. Metrics might tell you that errors increased at 2:47 PM. Logs tell you why.
3. Kubernetes Traces
Distributed traces follow a single request as it travels through multiple services. Each trace shows the complete journey—every service hop, database call, and external API request along the way.
In microservices architectures, a single user action might touch dozens of services. Without traces, finding where a request slowed down becomes guesswork. With traces, you can see exactly which service added 800ms of latency.
| Pillar | What It Captures | Best Used For | Common Tools |
|---|---|---|---|
| Metrics | Numerical measurements over time | Trends, thresholds, alerting | Prometheus, Datadog |
| Logs | Timestamped event records | Debugging, audit trails | Elasticsearch, Loki |
| Traces | Request paths across services | Latency analysis, dependencies | Jaeger, Zipkin |
Kubernetes monitoring vs observability
Monitoring and observability get used interchangeably, but they solve different problems. The distinction matters when you’re deciding what to build.
Monitoring tracks predefined metrics and alerts when values cross thresholds you’ve already set. It answers questions you know to ask: Is the CPU above 80%? Is the error rate above 1%? Is the service responding?
Observability goes further. It enables you to investigate problems you didn’t anticipate. When something breaks in a way you’ve never seen before, observability gives you the tools to explore your system’s behavior and discover the root cause without having predicted it in advance.
- Monitoring: Watches for known failure patterns with predefined alerts
- Observability: Enables exploration of novel issues through correlated data
Kubernetes environments benefit from observability because of their complexity. With hundreds of pods, dozens of services, and constant churn, you can’t predict every failure mode. You need the ability to ask new questions when unexpected problems show up.
Why unified observability matters for Kubernetes clusters
The case for unified observability comes down to speed. When your metrics, logs, and traces live in separate systems, every investigation requires manual correlation across tools.
Picture a typical incident: an alert fires because error rates increased. With fragmented tooling, you check the metrics dashboard, then search logs in a different system, then try to find related traces in yet another tool. Each transition breaks your flow and adds minutes to resolution time.
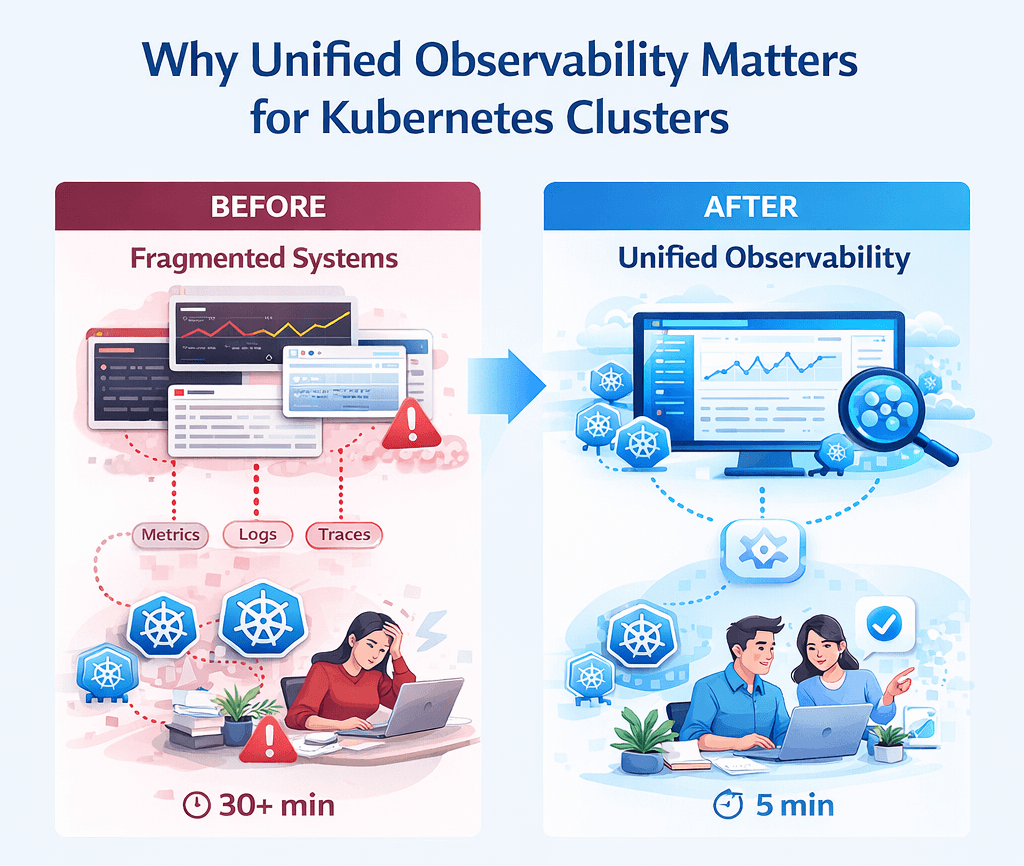
Unified observability changes this workflow. You click from the alert to related logs to the specific trace that shows the failure, all within the same interface. Investigation that used to take 30 minutes of context switching can happen in 5 minutes of focused work.
- Faster root cause analysis: Correlated data eliminates manual cross-referencing between tools
- Reduced mean time to resolution: Engineers spend time fixing problems, not searching for them
- Better collaboration: Everyone works from the same source of truth
- Proactive detection: Patterns across pillars reveal issues before they escalate into outages
Key challenges of observability in Kubernetes environments
Building unified observability for Kubernetes isn’t straightforward. Several characteristics of container orchestration create obstacles that traditional monitoring wasn’t designed to handle.
1. Tool sprawl and fragmented data
Most teams accumulate observability tools organically over time. You might have Prometheus for metrics, a separate logging solution, and another tool for traces. Each system has its own query language, its own dashboards, and its own way of identifying resources.
This fragmentation creates data silos. Correlating information across tools becomes a manual, error-prone process that slows down every investigation.
2. Alert fatigue and noise
When alerts come from multiple uncorrelated systems, teams get overwhelmed. The same underlying issue might trigger alerts in your metrics tool, your log aggregator, and your APM platform simultaneously.
Without correlation, each alert looks like a separate problem. Engineers waste time investigating duplicates while important signals get lost in the noise.
3. Dynamic and ephemeral workloads
Kubernetes pods are temporary by design. A pod might exist for minutes or hours before being replaced. Traditional monitoring that tracks hosts and IP addresses can’t keep up with this churn.
Effective Kubernetes observability tracks workloads by labels and metadata rather than by infrastructure identifiers. This requires tooling that understands Kubernetes-native concepts like deployments, services, and namespaces.
4. Multi-cluster and multi-cloud complexity
Many organizations run multiple Kubernetes clusters across different cloud providers or regions. Maintaining consistent visibility across all of them adds another layer of difficulty.
Each cluster might have slightly different configurations, different versions, or different networking setups. Unified observability requires a collection approach that normalizes data across all environments.
5. Scaling observability infrastructure
Kubernetes generates enormous amounts of telemetry data. A large cluster might produce millions of metrics, gigabytes of logs, and thousands of traces every minute.
The observability infrastructure itself becomes a scaling challenge. High-cardinality data from labels and annotations can overwhelm storage and query systems if not managed carefully.
Essential features of unified Kubernetes observability platforms
When evaluating observability solutions, certain capabilities separate truly unified platforms from tools that simply aggregate data in one place.
1. Centralized data collection
A unified platform starts with consistent collection across all clusters and workloads. This typically means deploying agents or collectors that gather metrics, logs, and traces through a single pipeline.
OpenTelemetry has emerged as the standard for this collection layer. It provides vendor-neutral instrumentation that works across languages and frameworks.
2. Correlated metrics, logs, and traces
True unification requires more than putting data in the same place. The platform links data across pillars using common identifiers like trace IDs, pod names, and custom labels.
When you view a trace, you can immediately see the related logs and metrics without searching. This correlation happens automatically based on shared context.
3. Unified dashboards and visualization
A single interface for all observability data reduces cognitive load. Engineers learn one query language, one navigation pattern, and one way of building dashboards.
The best platforms allow seamless drill-down from high-level cluster health to specific pod logs to individual trace spans, all without leaving the interface.
4. Smart alerting and anomaly detection
Intelligent alerting reduces noise through correlation and deduplication. Instead of firing separate alerts for symptoms of the same problem, the platform groups related signals together.
Baseline-aware thresholds adapt to normal patterns rather than relying on static values that generate false positives during expected traffic changes.
5. OpenTelemetry and open-source compatibility
Vendor-neutral instrumentation protects your investment. If you instrument with OpenTelemetry, you can switch backends without re-instrumenting your applications.
Open-source compatibility also means you can integrate with existing tools rather than replacing everything at once.
| Feature | What It Does | Why It Matters |
|---|---|---|
| Centralized collection | Gathers all telemetry through one pipeline | Consistent data quality and coverage |
| Data correlation | Links metrics, logs, traces automatically | Faster investigation without manual joins |
| Unified dashboards | Single interface for all data types | Reduced context switching |
| Smart alerting | Groups and deduplicates related alerts | Less noise, clearer signals |
| Open standards | Vendor-neutral instrumentation | Flexibility and no lock-in |
How AI and machine learning enhance Kubernetes observability
Machine learning adds practical value to observability in a few specific ways. Automated anomaly detection spots unusual patterns without requiring you to define every threshold manually. Predictive alerting warns you about problems before they affect users.
Root cause suggestions analyze correlated data and surface likely explanations, reducing the time engineers spend forming hypotheses. Noise reduction filters out duplicate and low-priority alerts so the important signals stand out.
- Anomaly detection: Identifies unusual patterns without predefined thresholds
- Predictive alerting: Warns about problems before user impact
- Root cause suggestions: Surfaces likely explanations from correlated data
- Noise reduction: Filters duplicate and low-priority alerts
Top tools for unified Kubernetes observability
Several tools have become standard components in Kubernetes observability stacks. Understanding their roles helps you assemble a coherent solution.
1. OpenTelemetry
OpenTelemetry provides vendor-neutral APIs and SDKs for generating telemetry data. It’s become the industry standard for instrumentation, supported by all major observability vendors.
2. Prometheus
Prometheus remains the default choice for Kubernetes metrics. Its pull-based model, powerful PromQL query language, and native Kubernetes service discovery make it a natural fit.
3. Grafana
Grafana unifies visualization across data sources. It connects to Prometheus, Loki, Jaeger, and dozens of other backends, providing a single dashboard interface for all of them.
4. Elastic Stack
Elasticsearch, Logstash, and Kibana (the ELK stack) provide powerful log aggregation and search. Recent versions include native Kubernetes integration and APM capabilities.
5. Jaeger
Jaeger is an open-source distributed tracing backend originally developed at Uber. It integrates well with OpenTelemetry and provides clear visualization of request flows across services.
Fluentd and Fluent Bit
Fluentd and Fluent Bit are lightweight log collectors designed for Kubernetes environments. Fluent Bit in particular has minimal resource overhead, making it suitable for large-scale deployments.
Best practices for Kubernetes cluster observability
Getting the most value from unified observability requires consistent practices across your organization.
Standardize instrumentation across services
Adopt common instrumentation libraries and conventions for all applications. When every service emits telemetry the same way, correlation and analysis become much simpler.
Use labels and annotations consistently
Kubernetes labels are the key to filtering and grouping observability data. Establish naming conventions for labels like app, team, environment, and version, then enforce them across all workloads.
Correlate data across observability pillars
Inject trace IDs into your logs so you can jump from a log entry directly to the related trace. Use consistent pod and service labels across metrics, logs, and traces.
Automate observability as code
Manage dashboards, alerts, and collection configurations through version control. Tools like Grafana’s provisioning and Prometheus Operator make this straightforward.
Continuously tune alerts and thresholds
Review alerting rules regularly. Remove alerts that never fire or always fire. Adjust thresholds based on actual system behavior rather than theoretical values.
How Obsium delivers unified Kubernetes observability
At Obsium, we’ve seen teams struggle with fragmented observability more times than we can count. The pattern is consistent: too many tools, too much noise, and too little insight when it matters most.
Our approach combines deep Kubernetes expertise with unified observability that actually works in production. We build on open-source foundations like Prometheus, Grafana, and OpenTelemetry, then add the integration and intelligence that turns raw data into actionable insights.
- Unified dashboards: Consolidated view of logs, metrics, alerts, and cluster health in one place
- Smart alerting: Correlation and deduplication that reduces noise without missing real issues
- Seamless integration: Works with your existing stack, from Kubernetes to multi-cloud environments
- 24/7 managed monitoring: Enterprise-grade coverage for teams that want ongoing support
The result is observability that helps you understand what’s happening, why it’s happening, and what to do about it.
Contact Us to discuss unified observability for your Kubernetes clusters.
FAQs about unified observability for Kubernetes
How do I unify observability across multiple Kubernetes clusters?
Deploy OpenTelemetry Collectors in each cluster that forward data to a shared backend. The key is consistent labeling across all clusters so you can filter and aggregate data regardless of where it originated. Most unified platforms support multi-cluster views out of the box.
What is the typical cost structure for implementing unified Kubernetes observability?
Costs depend primarily on data volume and retention requirements. Open-source stacks like Prometheus and Grafana eliminate licensing fees but require operational investment to run and maintain. Commercial platforms shift that burden but charge based on data ingestion or host count.
How does unified observability reduce incident response time?
Correlated data eliminates the manual work of cross-referencing between tools. When you can click from an alert to related logs to the specific trace showing the failure, investigation that used to take 30 minutes can happen in 5.
Can unified observability platforms work with on-premises Kubernetes clusters?
Yes. OpenTelemetry, Prometheus, Grafana, and most other observability tools can run entirely on-premises. Many organizations use hybrid configurations where collection happens on-prem but data flows to cloud-hosted backends for analysis and long-term storage.
What is the recommended approach for migrating from separate monitoring tools to unified observability?
Start by deploying OpenTelemetry alongside your existing tools. Collect data in parallel while you build new dashboards and alerts in the unified platform. Once you’ve validated coverage, gradually transition teams to the new system before decommissioning legacy tools.