Kubernetes adoption has skyrocketed, with surveys showing up to 96% of enterprises using it and more than 5.6 million developers working with it worldwide. But as usage grows, so does complexity. Highly dynamic, distributed workloads make it difficult to understand what’s happening inside a cluster at any given moment.
As experts often note, “monitoring shows the symptom; observability helps find the cause.” Traditional monitoring falls short in Kubernetes environments where pods are ephemeral, services are interconnected, and a single request may pass through dozens of microservices.
Observability fills this gap by allowing teams to explore why issues occur, not just when. It helps answer critical questions like: Why is latency increasing? Which service is degrading? Where does a request fail along its path?
This guide explains the core pillars of Kubernetes observability — metrics, logs, and traces — and walks through practical implementation strategies, common challenges, and tools that help teams build real visibility into their containerized systems.
What is Kubernetes Observability
Kubernetes observability is the ability to understand the internal state of containerized applications and the infrastructure supporting them by collecting and correlating metrics, logs, and traces. It moves beyond traditional monitoring, which focuses on a fixed set of known metrics and predefined alerts, and instead provides the depth and flexibility needed to diagnose unknown issues — the ones you didn’t anticipate and didn’t instrument for in advance.

Where monitoring might tell you that your application is experiencing latency, observability gives you the tools to uncover why it’s happening. This distinction becomes critical in Kubernetes environments, where applications are distributed, ephemeral, and dynamically scaled.
With services interacting across multiple layers and components, teams need the ability to ask new, open-ended questions about system behavior and quickly assemble answers from observable data.
Before exploring observability in practice, a few foundational Kubernetes concepts help set the stage:
Containers
Self-contained, lightweight execution units that package everything an application needs — code, runtime, libraries, and configuration — ensuring consistent behavior across environments.
Clusters
Collections of machines (nodes) that run containerized workloads under the direction of a central control plane, providing a unified platform for deployment, scaling, and management.
Orchestration
The automated coordination of container lifecycle events — including scheduling, scaling, healing, and networking — that Kubernetes performs to ensure applications run reliably at scale.
Why Kubernetes Observability Matters
When teams can quickly understand what's happening inside their systems, they spend less time reacting to problems and more time preventing them. Observability provides the visibility required to reduce downtime, speed up root cause analysis, and improve application performance.
Without proper observability, teams often find themselves guessing at problems or spending hours manually piecing together data from different sources. In complex containerized environments where services depend on each other, a small issue in one component can cascade into a major outage. Having clear visibility into the entire system makes the difference between a five-minute fix and a five-hour investigation.
As Charity Majors put it:
“What’s interesting is that monitoring hasn’t really changed … 20 years. … We’ve entered an era where what matters is the health of each individual event, or each individual user’s experience … With distributed systems you don’t care about the health of the system, you care about the health of the event or the slice.”
Kubernetes Observability vs Monitoring
Monitoring and observability are related but distinct concepts. Monitoring involves tracking predefined metrics and known failure modes, essentially answering questions you already know to ask. Observability, by contrast, enables exploration of unknown issues by providing the data and tools to investigate problems you haven't anticipated.
| Feature | Monitoring | Observability |
|---|---|---|
| Purpose | Tracking predefined metrics and known failures | Exploring unknown issues and system behavior |
| Approach | Viewing dashboards for expected states | Ad-hoc querying and data exploration |
| Data Types | Primarily metrics | Metrics, logs, and traces combined |
| Example Use Case | Alerting when CPU exceeds 90% | Debugging why a specific user request failed |
Monitoring tracks predefined metrics and known failure conditions. It answers questions you already expect — for example, alerting when CPU usage is too high or a service stops responding.
Observability goes deeper. By combining metrics, logs, and traces, it helps teams investigate unknown issues, understand complex behavior, and uncover the root cause of problems without needing to add new instrumentation.
In short: monitoring tells you something is wrong; observability helps you understand why.
The Three Pillars of Kubernetes Observability
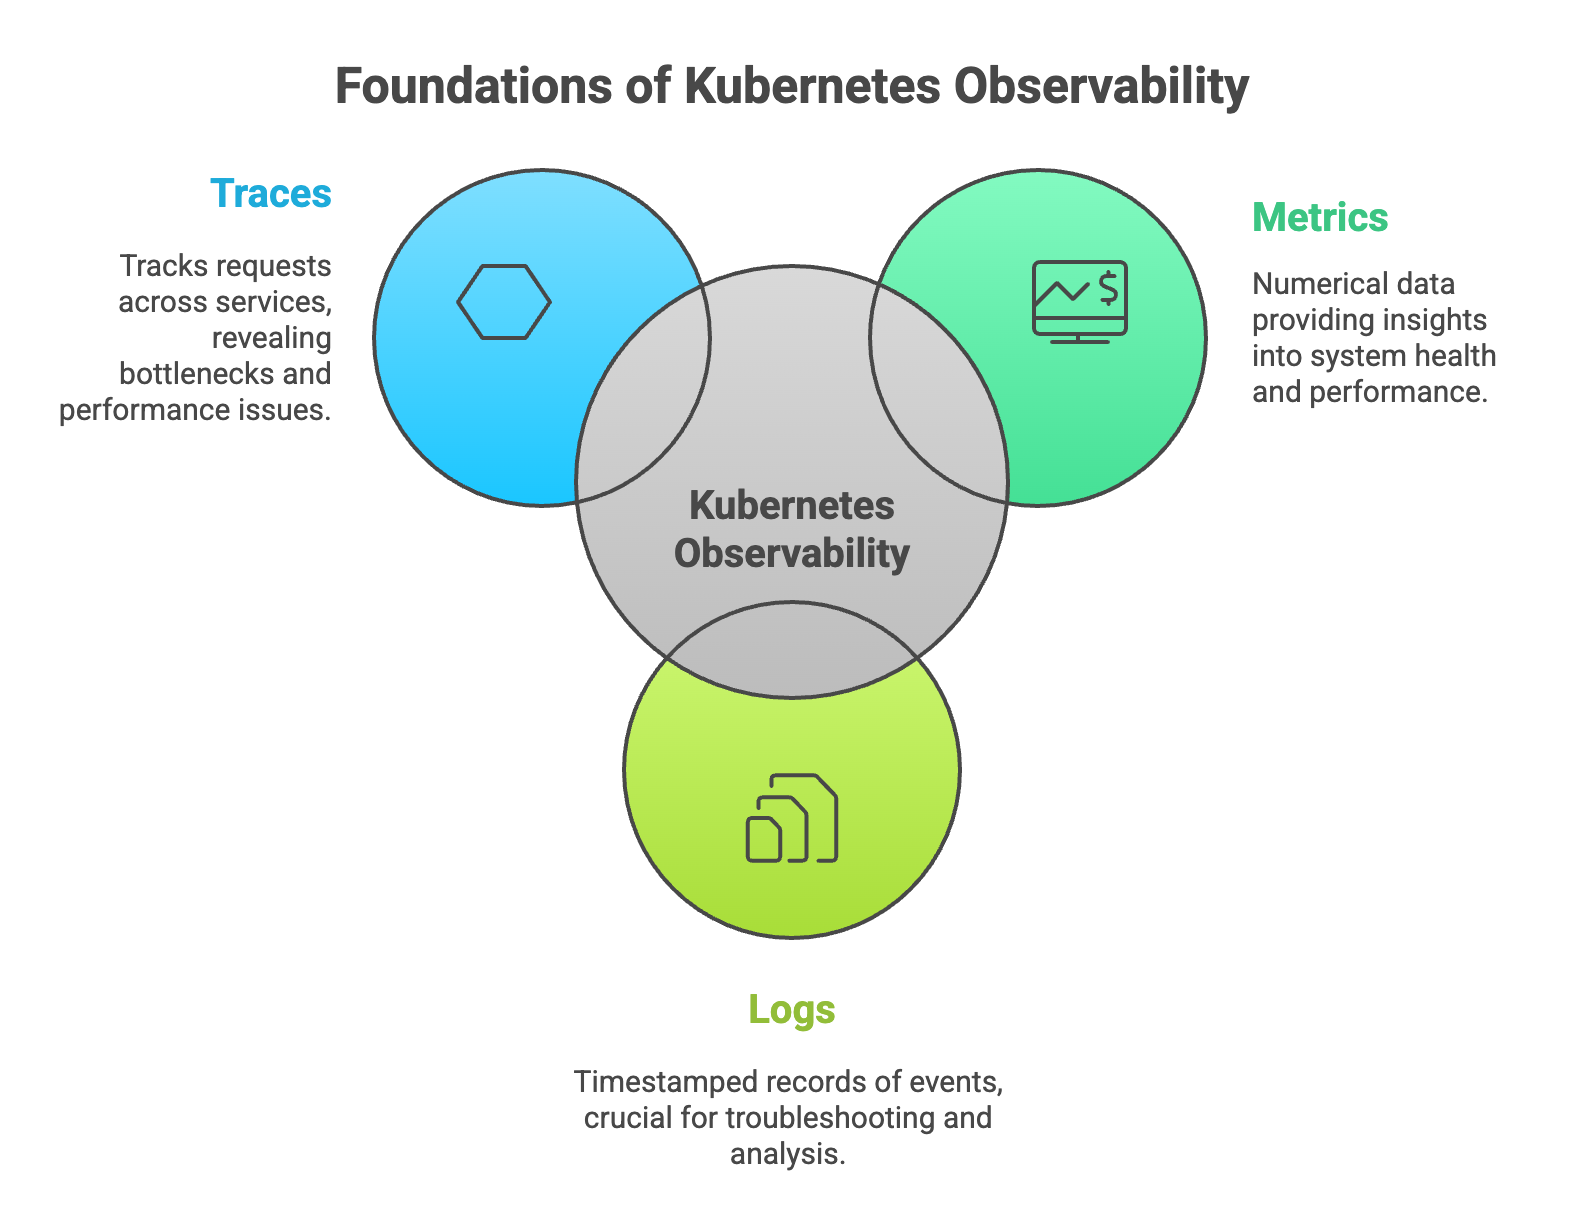
The three foundational data types that enable comprehensive cluster visibility are metrics, logs, and traces. Each provides a different lens into system behavior, and together they create a complete picture of what's happening across your applications and infrastructure.
1. Metrics
Metrics are numerical measurements collected over time that describe system health and performance. Common Kubernetes metrics include CPU usage, memory consumption, pod health, and network throughput. These numbers are typically collected at regular intervals and stored in time-series databases for analysis and alerting.
Metrics generally fall into three categories:
- Resource metrics: Data about hardware and infrastructure, such as CPU and memory usage at the node or container level.
- Application metrics: Custom measurements specific to your applications, like request rates, error counts, or queue depths.
- Cluster metrics: Information about the Kubernetes cluster itself, including node status, pod counts, and deployment health.
2. Logs
Logs are timestamped, immutable records of discrete events that have occurred within your system. In Kubernetes environments, logs come from multiple sources: container output, application logging, and cluster-level components like the kubelet or API server.
Here's the challenge with Kubernetes logging: pods are ephemeral. They can be created and destroyed automatically in response to scaling events or failures, and when a pod disappears, its logs go with it. For this reason, centralized log aggregation becomes essential. By shipping logs to a central location as they're generated, teams can retain and search log data even after the original pods are gone.
3. Traces
Distributed tracing tracks requests as they travel across multiple services in a microservices architecture. When a user action triggers a chain of service calls, traces connect all those calls together, showing exactly how long each step took and where bottlenecks occurred.
Two terms come up frequently in tracing discussions. A span represents a single operation or unit of work within a trace, such as a database query or an API call. A trace ID is a unique identifier that links all the spans belonging to a single request, allowing you to follow a request's complete journey through your system.
Common Kubernetes Observability Challenges
Achieving observability in Kubernetes environments presents unique difficulties compared to traditional infrastructure. The dynamic, distributed nature of containerized applications creates several obstacles that teams commonly encounter.
1. Disparate Data Sources
Kubernetes generates data from multiple layers simultaneously: nodes, pods, containers, and the applications running inside them. Each layer produces its own metrics, logs, and events. Correlating information across all these sources to understand a single incident can be surprisingly difficult, especially when data lives in different tools or formats.
“Modern systems generate more data than humans can ever hope to interpret manually. Observability is about making that data usable.”
— Charity Majors, Honeycomb Co-founder
2. Dynamic and Ephemeral Environments
Kubernetes automatically scales applications up and down, creating and destroying pods in response to demand. IP addresses and pod names are temporary, changing whenever pods restart or reschedule. Traditional monitoring approaches that rely on static targets struggle in this environment because the targets keep moving.
With organizations running hundreds or thousands of pod churn events per hour in production clusters, persistent identifiers quickly become unreliable.
3. Alert Fatigue
Industry studies report that over 70% of engineering teams experience alert fatigue, contributing to slower incident response and higher burnout risk.
Large Kubernetes environments generate enormous volumes of data, which can translate into excessive alerts. When teams receive too many notifications, they start ignoring them, and important signals get lost in the noise. Distinguishing meaningful alerts from benign fluctuations becomes a significant operational challenge.
“Too many alerts desensitize teams. If everything is an emergency, nothing is.”
— Rob Ewaschuk, Google SRE
4. Cost Management
Observability tools can generate substantial storage and processing costs, particularly at scale. Every metric scraped, log line stored, and trace recorded consumes resources. Balancing comprehensive data collection with cost efficiency requires ongoing attention and optimization.
How to Implement Kubernetes Observability
Implementing observability involves more than installing tools. A structured approach helps ensure that the data you collect actually serves your operational goals.
1. Define Observability Goals and SLOs
Before selecting any tools, it helps to establish clear Service Level Objectives (SLOs). Identify your most critical services and define acceptable performance thresholds for metrics like latency, error rate, and availability. These goals provide a foundation for deciding what to measure and when to alert.
2. Select Your Observability Stack
Tool selection depends on your environment's size, data volume, team expertise, and budget. Some organizations prefer open-source stacks that offer flexibility and avoid vendor lock-in. Others choose commercial platforms that provide unified interfaces and reduce operational overhead. Many end up with hybrid approaches that combine elements of both.
3. Instrument Applications and Services
Instrumentation is the process of adding code or agents to your applications so they emit observability data. This can involve adding libraries directly to your application code, deploying sidecar containers that collect data automatically, or using agents that run on each node. The right approach depends on your applications and how much control you have over their code.
4. Configure Data Collection and Storage
Once instrumentation is in place, you'll configure pipelines to collect, process, and store the data. This includes setting up agents to scrape metrics, forward logs, and collect traces. Data retention policies and aggregation strategies help manage storage costs while ensuring you have the data you need for troubleshooting and analysis.
5. Build Dashboards and Alerting Rules
Dashboards visualize key metrics and system health indicators, giving teams a quick way to assess the current state of their environment. Alerting rules notify teams when something requires attention. Effective alerts are tied to your SLOs, include enough context to be actionable, and avoid generating noise for conditions that don't require immediate response.
Top Kubernetes Observability Tools
A variety of tools can help implement Kubernetes observability, ranging from built-in Kubernetes features to comprehensive commercial platforms.
| Category | Examples | Best For |
|---|---|---|
| Built-in Tools | kubectl, Kubernetes Dashboard, Metrics API | Basic inspection and quick troubleshooting |
| Open Source | Prometheus, Grafana, Jaeger, Fluentd | Customizable stacks with community support |
| Commercial Platforms | Datadog, New Relic, Dynatrace, Splunk | Unified solutions with enterprise features |
Built-in Kubernetes Tools
Kubernetes includes native features for basic observability. The kubectl command-line tool allows you to inspect resource states, view logs, and debug running containers. The Kubernetes Dashboard provides a web-based interface for similar tasks. The Metrics API exposes fundamental resource metrics like CPU and memory usage. While useful for quick checks, these built-in tools lack the depth and retention capabilities required for comprehensive observability.
Open Source Observability Tools
The open-source ecosystem provides powerful, widely-adopted tools that many organizations use as the foundation of their observability stack:
- Prometheus: A monitoring system and time-series database designed for collecting and querying metrics.
- Grafana: A visualization platform for creating dashboards from various data sources, including Prometheus.
- Jaeger: A distributed tracing system for monitoring request flows across microservices.
- Fluentd: A data collector that unifies log collection and routing from multiple sources.
Commercial Observability Platforms
Enterprise observability platforms offer unified solutions that combine metrics, logs, and traces in a single interface. These platforms often include advanced features like automated anomaly detection, AI-assisted root cause analysis, and pre-built integrations with common services. Major cloud providers also offer their own observability services, such as AWS CloudWatch and Google Cloud's operations suite.
Best Practices for Kubernetes Observability
Several practices can help teams get more value from their observability investments while avoiding common pitfalls.
1. Choose Tools That Match Your Environment
Tool selection depends on cluster size, complexity, and team capabilities. A small team with limited Kubernetes experience might benefit from a managed commercial platform that reduces operational burden. A large organization with dedicated platform teams might prefer the flexibility of an open-source stack they can customize to their specific requirements.
2. Set Clear Performance Goals
Service Level Objectives (SLOs) and Service Level Indicators (SLIs) provide quantitative benchmarks for system health. Rather than alerting on arbitrary thresholds, teams can alert when they're at risk of missing their SLOs. This approach focuses attention on what actually matters to users and the business.
3. Implement Context-Based Alerting
Effective alerts include relevant context: which service is affected, what cluster it's running in, and what the potential impact might be. Alert grouping and deduplication help reduce noise. The goal is alerts that are actionable, meaning someone can look at the alert and know what to investigate next.
4. Focus on Actionable Insights
Not all data is equally valuable. Collecting everything possible often creates more noise than signal. Instead, focus on high-cardinality data that allows you to slice and filter information to answer specific questions. The goal is finding the signal that helps you understand and resolve issues quickly.
5. Optimize Data Retention and Costs
Tiered storage strategies can help manage costs. High-granularity data is valuable for debugging recent issues but expensive to store long-term. Aggregated, lower-granularity data works well for trend analysis and capacity planning. Sampling strategies can reduce trace volumes while still providing representative data for analysis.
6. Standardize Across Teams
Consistent naming conventions, tagging strategies, and dashboard templates make observability data more accessible across the organization. When everyone uses the same labels and follows the same patterns, it becomes easier to correlate data across services and share knowledge between teams.
Building a Kubernetes Observability Strategy
Many teams struggle with slow incident response, unclear system behavior, and dashboards that don’t tell them what they need to know. A strong observability strategy fixes this by giving engineers real visibility into how services perform and where issues begin.
Effective observability goes beyond tools. It requires the right skills, consistent processes, and instrumentation built directly into development and deployment workflows. When this is missing, problems take longer to diagnose and outages become harder to prevent.
Obsium helps teams build observability practices that reduce noise, surface the right signals, and make Kubernetes environments easier to operate.
See how Obsium can help you improve reliability, resolve issues faster, and gain clarity across your clusters.
FAQs about Kubernetes Observability
What is the difference between Kubernetes and Docker?
Docker is a container runtime used to create and run individual containers. Kubernetes is a container orchestration platform that automates the deployment, scaling, and management of containerized applications across clusters of machines. Docker handles single containers, while Kubernetes coordinates many containers working together.
How do teams monitor Kubernetes jobs and workloads?
Teams can use the Kubernetes Jobs API to check completion status, resource usage, and failure events. For more detailed monitoring, observability tools collect logs, metrics, and traces from jobs to track execution time, resource consumption, and error patterns.
What is the relationship between Kubernetes and Prometheus?
Prometheus is an open-source monitoring tool commonly paired with Kubernetes. Kubernetes is the platform being monitored, while Prometheus scrapes metrics from Kubernetes components and applications. The two are often used together but serve different purposes.
What are Kubernetes pods and clusters?
Pods are the smallest deployable units in Kubernetes. A pod represents a single instance of a running process and can contain one or more containers that share resources. A cluster is a set of nodes (machines) that run containerized applications under Kubernetes management.
How can organizations measure observability effectiveness?
Common metrics include Mean Time to Detection (MTTD), which measures how quickly issues are discovered, and Mean Time to Resolution (MTTR), which measures how quickly they're fixed. Reductions in incident frequency and severity also indicate improved observability practices.
What is eBPF and how does it improve Kubernetes observability?
eBPF (extended Berkeley Packet Filter) is a Linux kernel technology that allows programs to run in the kernel without modifying kernel code. For observability, eBPF enables efficient, low-overhead data collection for networking, security, and application profiling, often without requiring changes to application code or additional sidecar containers.