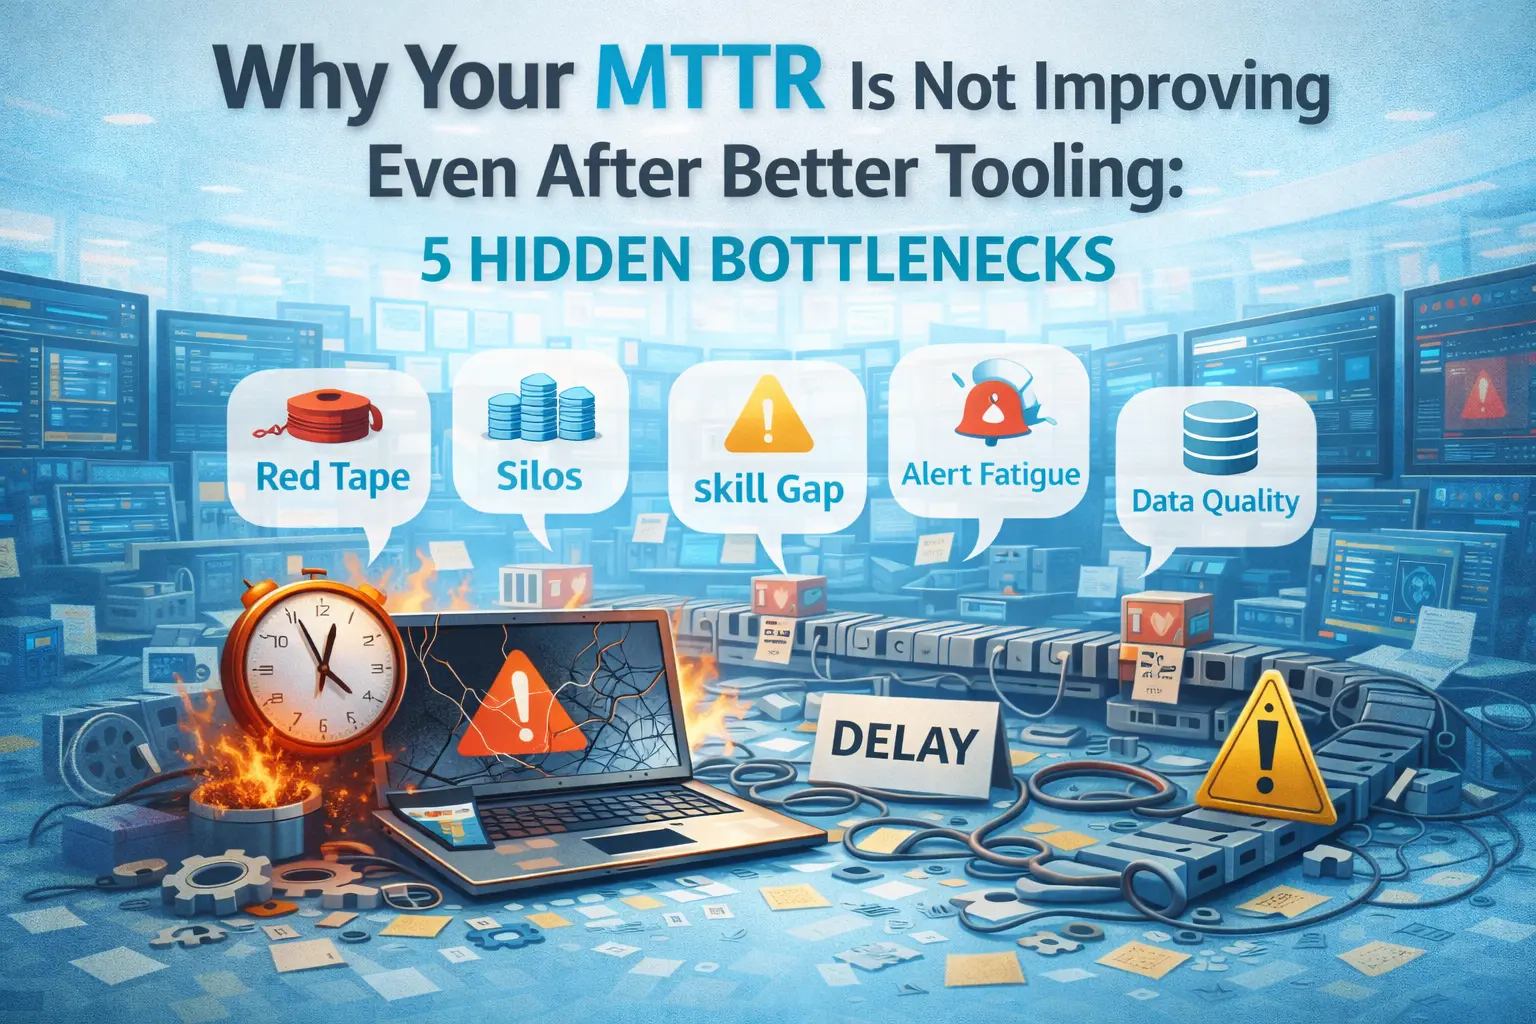
Why Your MTTR Is Not Improving Even After Better Tooling: 5 Hidden Bottlenecks
You upgraded your monitoring stack, deployed new dashboards, and integrated the latest observability tools. Six months later, your MTTR looks exactly the same.
The problem isn't your tooling. It's the hidden bottlenecks that tooling alone cannot fix: fragmented context, alert noise, knowledge silos, and organizational gaps that keep engineers stuck in diagnosis mode. This article breaks down why better tools fail to move the needle and what actually works to reduce incident resolution time.
What Does MTTR Mean and How Do You Calculate It
Despite significant investment in monitoring and observability tooling, many organizations find their Mean Time to Repair (MTTR) remains stubbornly high. The reason is straightforward: high MTTR is rarely caused by slow fixes. It's caused by slow understanding. New tools provide better telemetry, but they often increase cognitive load on engineers who then spend time manually correlating data across too many platforms.
MTTR measures the average time from when an incident begins to when normal service resumes. The calculation is simple: divide total downtime by the number of incidents resolved. If your team experienced 10 hours of downtime across 5 incidents last month, your MTTR is 2 hours.
The term carries multiple interpretations depending on context:
- Mean Time to Repair: Time spent fixing the failed component itself
- Mean Time to Resolve: Time until full service restoration for users
- Mean Time to Recover: Time from failure detection through return to normal operation
For SRE and DevOps teams, MTTR serves as a core reliability metric. A lower number signals faster incident response and healthier operational practices. Yet many teams plateau despite adding more dashboards and alerts, which brings us to the real question: what's actually blocking improvement?
How MTTR Relates to MTBF, MTTF, and Other Reliability Metrics
MTTR doesn't exist in isolation. Understanding where it fits among related metrics helps teams identify which phase of incident response actually requires attention.
Mean Time Between Failures and Mean Time to Failure
MTBF (Mean Time Between Failures) measures the average operational time between incidents. It's a predictive metric that indicates system stability. The formula is straightforward: total operational time divided by number of failures.
MTTF (Mean Time to Failure) applies specifically to non-repairable components. Think of a hard drive that fails and gets replaced rather than repaired. While MTTR focuses on recovery speed, MTBF and MTTF help teams anticipate when failures might occur.
Mean Time to Acknowledge and Mean Time to Detect
Two metrics often hide inside your MTTR number: MTTA and MTTD.
MTTA (Mean Time to Acknowledge) tracks how long it takes an engineer to respond after an alert fires. MTTD (Mean Time to Detect) measures the gap between when a failure occurs and when your systems notice it. Both directly inflate MTTR even when the actual repair is fast.
| Metric | What It Measures | Relationship to MTTR |
|---|---|---|
| MTTD | Time to detect failure | Delays here extend total MTTR |
| MTTA | Time to acknowledge alert | Slow response adds to resolution time |
| MTBF | Time between incidents | Higher MTBF means fewer MTTR events |
| MTTF | Time until component fails | Predicts when MTTR will be needed |
Why Better Monitoring Tools Alone Do Not Reduce MTTR
New tools provide visibility, but visibility alone doesn't translate into faster fixes. The gap between "seeing the problem" and "fixing the problem" is where most incident time actually lives.
The Gap Between Detection and Resolution
Faster alerting compresses MTTD, which is valuable. However, most incident time is spent in diagnosis and remediation, and tools alone cannot accelerate those phases without proper processes and unified context.
Consider a typical incident timeline. Detection might take 2 minutes with modern alerting. Acknowledgment adds another 5 minutes. But the remaining 45 minutes? That's engineers manually correlating data across platforms, forming hypotheses, and testing fixes. Better tools helped with the first 7 minutes while leaving the bulk of resolution time untouched.
When Dashboards Add Complexity Instead of Clarity
The average enterprise runs 10-15 different monitoring tools: Prometheus, Datadog, Splunk, PagerDuty, and more. Each tool provides valuable data, but fragmented visibility creates a new problem.
Engineers often spend a significant portion of incident time gathering information across various dashboards and logs. They're reconstructing what happened rather than analyzing it. More dashboards can actually slow resolution if they lack unified correlation, which is why tool consolidation matters as much as tool capability.
Five Hidden Bottlenecks That Keep Your MTTR High
Tooling investments plateau because the real blockers are organizational and process gaps. The following five bottlenecks explain why teams with excellent observability still struggle with slow incident resolution.
1. Tool Sprawl That Fragments Incident Context
Running multiple disconnected monitoring platforms forces engineers to manually piece together the incident picture. Metrics live in Prometheus, logs in Elasticsearch, traces in Jaeger, and APM data in yet another system.
During an incident, this fragmentation means opening multiple browser tabs, mentally correlating timestamps, and hoping nothing gets missed. The context reconstruction trap consumes time that could go toward actual diagnosis.
2. Alert Fatigue From Uncorrelated and Noisy Signals
Threshold-based alerting generates excessive notifications. When CPU spikes trigger alerts regardless of user impact, engineers learn to ignore or delay response. Critical alerts get buried in noise.
Many tools are configured to alert on symptoms (CPU high, memory pressure) rather than root causes. This configuration forces engineers to work backward from symptoms, adding investigation time to every incident.
3. Context Switching Across Disconnected Observability Systems
Each tool switch during an incident carries cognitive cost. Engineers lose their train of thought, re-orient to a new interface, and risk missing connections between data points.
Without automated correlation, multiple engineers may chase different leads simultaneously. This parallel investigation sounds efficient but often leads to duplicated effort and inconsistent conclusions.
4. Knowledge Silos and Outdated Runbook Documentation
Tribal knowledge and stale runbooks force engineers to rediscover solutions during every incident. The engineer who fixed this problem six months ago might be on vacation, and their notes live in a Slack thread nobody can find.
Repair time becomes dependent on who happens to be on call rather than on documented, repeatable procedures. This dependency creates unpredictable MTTR that varies wildly based on staffing.
5. Organizational Gaps in Cross-Team Incident Collaboration
Unclear escalation paths and poor communication between teams extend resolution time. Security, infrastructure, and application teams often have different priorities and tooling.
Incidents stall waiting for the right person to engage. Even when the problem is detected quickly, unclear ownership means team members waste time figuring out who can actually fix the issue.
How to Improve MTTR by Fixing Each Hidden Bottleneck
Addressing the bottlenecks above requires process and architecture changes, not just additional tooling. Each solution maps directly to a specific bottleneck.
1. Centralize Metrics Logs and Traces in One Unified Dashboard
Consolidating observability data into a single pane of glass eliminates the context reconstruction problem. OpenTelemetry provides a vendor-neutral way to collect and correlate telemetry across your stack.
A unified view accelerates root cause identification by showing relationships between signals:
- Unified metrics: CPU, memory, and request latency visible together
- Correlated logs: Filter logs by trace ID during incidents
- Distributed traces: Visualize request flow across microservices
2. Implement SLO-Based Smart Alerting to Reduce Noise
Shifting from static thresholds to service-level objective (SLO) based alerts changes what triggers notifications. Instead of alerting when CPU hits 80%, alert when error budget burn rate threatens your reliability target.
Error budgets define how much unreliability the system can tolerate while still meeting its SLOs. Alerting on user impact rather than infrastructure symptoms focuses attention on what actually matters to your users.
3. Automate Remediation With Executable Runbooks
Codifying common fixes as automated scripts removes human latency for known issues. When a specific alert fires, the system can execute the documented remediation steps immediately.
Tools like Rundeck or PagerDuty runbook automation turn tribal knowledge into repeatable, executable procedures. The engineer still gets notified, but the first response happens automatically.
4. Build Institutional Memory Through Historical Pattern Matching
Past incident data contains patterns that accelerate future diagnosis. Tagging incidents by symptoms, affected services, and root causes builds a searchable knowledge base.
AI-driven correlation can surface similar historical incidents during active troubleshooting. Instead of starting from scratch, engineers see what worked before and can apply proven solutions faster.
5. Establish Blameless Post-Incident Reviews for Continuous Learning
Blameless postmortems capture lessons without fear of punishment. When engineers feel safe discussing what went wrong, organizations learn faster and avoid repeating the same mistakes.
Regular review cadence and action item tracking prevent repeated incidents. Each postmortem that leads to a systemic fix gradually lowers MTTR over time.
Metrics That Reveal Whether Your MTTR Is Actually Improving
A single MTTR number can hide important details about where time is actually spent. Breaking down the metric reveals which interventions are working.
Leading Indicators Beyond Average Resolution Time
Track metrics that surface problems before they show up in aggregate MTTR:
- Time to acknowledge: Measures on-call responsiveness
- Time in triage vs. repair: Reveals whether diagnosis or fix is the bottleneck
- Repeat incident rate: Indicates whether root causes are actually addressed
Tracking Time to Identify and Time to Root Cause Separately
Separating MTTR into sub-metrics, specifically time to identify and time to root cause, reveals whether slow resolution comes from detection gaps or diagnosis complexity.
If detection is fast but root cause identification is slow, the problem is correlation and context. If detection itself is slow, the problem is instrumentation coverage.
How Unified Observability Accelerates Incident Resolution
Unified observability directly addresses the five bottlenecks by consolidating telemetry, correlating signals automatically, and reducing the cognitive load on engineers during incidents.
Platforms that combine metrics, logs, and traces with intelligent correlation eliminate tool sprawl. Smart alerting based on SLOs rather than static thresholds cuts noise. When engineers open a single dashboard and immediately see correlated data, diagnosis time drops dramatically.
At Obsium, we help teams build unified observability foundations using open-source tools like Prometheus, Grafana, and Loki. This approach gives SRE teams the signals they need to protect user experience while providing the feedback loops required to continuously improve incident response.
Build Reliable Operations With the Right Foundation
MTTR improvement requires addressing process, people, and tooling together. Better dashboards alone won't fix fragmented context, alert fatigue, or knowledge silos.
The five hidden bottlenecks, including tool sprawl, alert noise, context switching, knowledge silos, and organizational gaps, explain why teams plateau despite significant observability investments. Fixing each bottleneck systematically delivers measurable reliability gains.
Teams ready to reduce incident resolution time can Contact Us for a consultation on unified observability and SRE practices.
Frequently Asked Questions About MTTR Improvement
What is a good MTTR benchmark for cloud-native teams?
MTTR benchmarks vary by industry and system criticality. High-performing cloud-native teams typically aim for resolution within minutes for critical incidents. The right target depends on your SLOs and the business impact of downtime.
How long does it typically take to see MTTR improvements after implementing process changes?
Teams often see measurable MTTR reductions within one to two incident cycles after consolidating observability data and implementing SLO-based alerting. Sustained improvement requires ongoing postmortem discipline and runbook maintenance.
Does engineering team size affect mean time to repair?
Larger teams can parallelize incident response but may struggle with coordination overhead. Clear escalation paths and unified tooling matter more than headcount for reducing MTTR.
Can mean time to repair be too low?
Extremely low MTTR could indicate that teams are applying quick fixes without addressing root causes, leading to repeat incidents. Sustainable reliability requires balancing fast resolution with thorough remediation.

Ready to Get Started?
Let's take your observability strategy to the next level with Obsium.
Contact Us