Get in Touch
Close

Your Cloud Story,
Engineered for Success

Contacts

US Office: Obsium, 6200,
Stoneridge Mall Rd, Pleasanton CA 94588 USA

Kochi Office: GB4, Ground Floor, Athulya, Infopark Phase 1, Infopark Campus Kakkanad, Kochi 682042

+91 9895941969

hello@obsium.io

observability solutions

Observability that lets you see everything, understand anything.

At Obsium, observability isn't a feature — it's our foundation. We design, build, and operate stacks that fit your infrastructure, compliance, and workflow — metrics, logs, and traces unified into one actionable view, on open-source tooling, with zero vendor lock-in. See everything, understand anything, and respond with confidence.

Isometric illustration of observability — system health dashboards, end-to-end visibility across metrics, logs, traces, events and alerts, and the detect-to-resolve workflow
0
open source, zero lock-in
0
lower telemetry cost in audits
0
uptime SLOs we sign up for
0
monitoring & on-call coverage
partnerships

Powerful Partnerships

Certified across the three major clouds — one observability view, wherever your workloads run.

Microsoft Azure partner
AWS Partner Network
Google Cloud partner
why it matters

Why do you need observability?

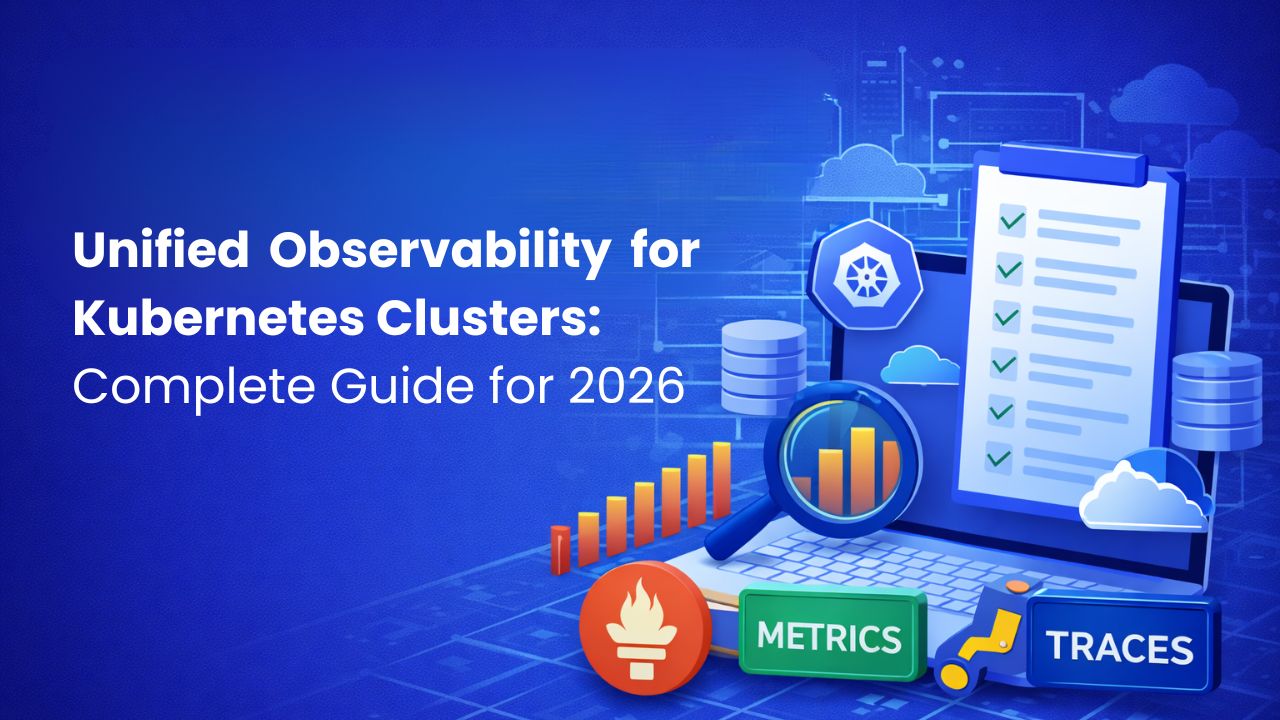
Monitoring tells you a dashboard went red. Observability tells you why — and lets you ask questions you didn't predict when the system was built. As services multiply and go distributed, "check the logs" stops scaling; you need metrics, logs, and traces correlated in one place so your team finds root cause in minutes, not hours — before customers feel it.

  • Full-stack metrics, logs & traces
  • OpenTelemetry instrumentation
  • Dashboards & smart alerting
  • SLOs & error budgets
  • Air-gapped & secure deployments
  • Telemetry cost optimization
services / 01–06

Everything visibility needs, nothing it doesn't.

Six disciplines, one partner — the layers that turn scattered dashboards into answers. Open source, deployed in your environment, owned by your team.

01

Full-Stack Observability

Unified visibility across your infrastructure, services, and applications. Metrics, logs, and traces come together in one actionable view — with dashboards built for your team and smart alerts that surface what truly matters.

metricslogstracesdashboards
02

Custom-Built Observability

Your systems are unique; your observability should be too. From agents to databases to dashboards, we architect and deliver fully custom stacks that match your environment and scale with your growth.

bespokeagentspipelinesscale
03

OpenTelemetry Instrumentation

We instrument your apps and services with OpenTelemetry so telemetry is standardized, vendor-neutral, and portable — the data foundation everything else builds on.

OpenTelemetrytracingauto-instrumentstandards
04

SLOs, Alerting & Incident Insight

Alerts tuned to real user impact, SLOs and error budgets that make reliability measurable, and the context on-call needs to resolve fast — not another wall of red.

SLOsalertingerror budgetson-call
05

Air-Gapped & Secure Deployments

Operate in high-security or regulated environments? We build self-contained, air-gapped observability stacks that meet the strictest compliance requirements — full visibility entirely within your network.

air-gappedon-premcomplianceprivate
06

Telemetry Cost Optimization

Observability data grows faster than budgets. We cut noise, tier storage, and right-size retention so you keep the signal and drop the bill — without losing what matters in an incident.

cost controlsamplingretentioncardinality
Want this scoped for your systems?A free 30-minute call — no deck, just an honest read on your blind spots.
Talk to an observability engineer
how we engage

Assess, build, embed — or run observability for you.

Plug us in at the level you need — from an observability assessment to engineers who instrument and run the stack with your team.

Observability Assessment

A review of your current monitoring, coverage gaps, and alert noise with a prioritized roadmap.

Build & Instrument

We design and build the stack — collection, storage, dashboards, alerting — then hand it over documented.

our specialty

Embedded Observability Engineers

Senior engineers who embed with your team, instrument your systems, and accelerate your observability journey.

Managed Observability

We run and evolve your observability stack 24/7 as an ongoing partner, so signal stays high and cost stays low.

the honest table

How Obsium compares

Three ways to get real observability. Here's the trade, stated plainly.

 DIY in-houseSaaS vendorObsiumrecommended
What you getDashboards, no answers~A tool, not a practiceAnswers to questions you didn’t predict
Who does the work~Team learning as they goYou, with their docsSenior observability engineers
Tooling~Whatever’s easiestA pricey SaaS you can’t leaveOpen source, yours to keep
Data cost~Grows uncheckedBilled per GB, foreverRight-sized, cost-controlled
Air-gapped & regulated~Possible, painfulUsually not supportedRoutine, entirely in your network
Alerts~Noisy, ignored~Out-of-the-box thresholdsTuned to real user impact
Pricing~Salaries + tool sprawlPer-seat & per-GB, creepingFixed range, scoped by outcome
Ready to see what Obsium would do differently?Bring your current stack; leave with a written fixed-range plan.
Talk to an observability engineer
how it works

How an observability engagement works

Four stages. Written deliverables at every one. Your engineers in the room throughout.

01 weeks 1–2

Assess & Baseline

We audit your current monitoring, coverage gaps, and alert noise against what your team actually needs to answer. You get findings ranked by blind spot and risk.

02 weeks 2–4

Design & Instrument

Collection, storage, OpenTelemetry instrumentation, dashboards, and alerting designed for your stack — documented, with the first real dashboards live from day one.

03 weeks 4–12

Build & Embed

Staged rollout alongside your team, service by service, with our engineers embedded so your people can run and extend the stack themselves.

04 ongoing

Operate & Optimize

We stay on as an escalation point or run monitoring with you. Monthly reviews cut noise, tune SLOs, and control data cost so signal stays high.

Curious what your first two weeks would look like?Talk through an observability assessment with a senior engineer.
Talk to an observability engineer
why obsium

Observability is our foundation, not a feature.

For most vendors, observability is a product to sell you — priced per gigabyte, locked to their platform, and half-abandoned once the contract's signed. Six months later you're paying more to see less.

We work differently. Observability is all we're built on. We deploy proven open-source tools inside your environment, so your metrics, logs, and traces stay private, portable, and fully yours. We embed with your team and leave the stack, dashboards, and runbooks in your hands — no lock-in, no surprise bill.

/01 Built on Trusted Open-Source Foundations

Proven open-source observability tools mean transparency, flexibility, and zero lock-in — reliable, battle-tested technology you control.

/02 Deployed Inside Your Environment

Obsium runs within your infrastructure, keeping metrics, logs, and traces private, compliant, and fully under your control.

/03 Optimized for Modern Infrastructure

Across Kubernetes, serverless, and hybrid systems, we scale with growth, detect anomalies, and simplify complexity.

/04 Engineers Who Live and Breathe Observability

From request tracing to monitoring optimization, our engineers solve complex visibility challenges as a specialty, not a side-line.

results

Observability that holds up in production.

Real full-stack observability, platform, and modernization engagements across banking SaaS, financial services, and multi-site enterprises.

us banking saas / observability
3 → 1

Full-stack observability, fully private

A multi-tenant Grafana LGTM platform with an S3 backend and Terraform provisioning — collection agents cut from three to one per cluster, zero-touch onboarding, and no public-internet telemetry exposure.

Read the case study →
financial services / platform
300+

Observability built into the platform

An internal developer platform on GitHub Actions, Argo CD, and cert-manager with observability wired in from day one — self-serve deploys under two minutes, sustaining 300+ concurrent CI/CD runs with zero degradation.

Read the case study →
enterprise / migration
0 hrs

Zero-downtime migration, fully observed

A phased migration of 54 Windows Server workloads and ~18 TB off on-prem VMware to AWS — 0 hours downtime, 100% data integrity, and full visibility throughout the cutover.

Read the case study →

"We worked closely with Obsium on an application modernization project for a US-based healthcare customer. Their team successfully migrated the platform to AWS, implemented Kubernetes, and deployed a robust observability stack.

Obsium demonstrated deep expertise in cloud-native technologies and delivered the engagement with professionalism and technical excellence. We highly recommend Obsium for organizations seeking modern cloud, Kubernetes, and observability solutions."

Rinish K N — Rinish K N, CEO, Thoughtminds.io

Obsium has been our trusted partner whenever we need Cloud, DevOps, and Site Reliability Engineering (SRE) resources. Their team brings deep technical expertise and consistently delivers high-quality professionals who meet client expectations.

The resources provided by Obsium are well-vetted, technically sound, and interview-ready, enabling us to fulfil our client requirements quickly and confidently. We highly recommend Obsium to organizations seeking reliable Cloud, DevOps, and SRE talent, especially when there is a need to onboard skilled resources within short timelines.
Jisha Panicker — Jisha Panicker, Head of HR, Ellow Technologies

"Obsium was our preferred partner for implementing an MLOps platform for a Fortune 500 customer in the US. Their team brought strong technical expertise, practical implementation experience, and a proactive approach to the engagement.

They demonstrated excellent understanding of modern cloud, DevOps, and MLOps ecosystems, and executed the project with professionalism and reliability. We highly recommend Obsium to organizations seeking a dependable partner for DevOps and MLOps initiatives."

Rajesh P — Rajesh P, COO, Wizr.ai

"Obsium team quickly understands project requirements and brings strong technical depth to every engagement. What stands out is their practical approach to solving real infrastructure and operational challenges while maintaining a high standard of professionalism.

We value our collaboration with Obsium and would confidently recommend them to organizations looking for experienced cloud and DevOps expertise."

Real Prad — Real Prad, CEO, Sayone Technologies

"We've worked with Obsium on a few client projects where cloud and DevOps expertise was needed alongside our security work. Their team has good technical depth and has been professional to collaborate with."

Meera Saraswathi — Meera Saraswathi, Technology Risk Lead, ServerAudit
faq

Observability FAQs

What is observability?+
Observability is the ability to understand what's happening inside your systems from the data they emit — metrics, logs, and traces. Where monitoring tells you something broke, observability lets you ask why, including questions you didn't anticipate when the system was built.
What's the difference between monitoring and observability?+
Monitoring watches for known problems with predefined dashboards and alerts. Observability gives you the raw signals — correlated metrics, logs, and traces — to investigate unknown problems and find root cause fast. You need both: monitoring tells you something's wrong, observability tells you why.
Do you lock us into a specific vendor or tool?+
No. We build on proven open-source tools — Prometheus, Grafana, Loki, Tempo, OpenTelemetry, and the like — deployed inside your environment. The stack is yours to keep, run, and extend, with no per-gigabyte bill or platform you can't leave.
Can you deploy observability in air-gapped or regulated environments?+
Yes — it's one of the reasons teams come to us. We build fully self-contained, air-gapped observability stacks that keep every metric, log, and trace inside your network, meeting the strictest compliance and security requirements.
Will this reduce our observability costs?+
Usually, yes. SaaS observability is billed per gigabyte and grows unchecked. We cut noise, tune sampling and retention, and control cardinality so you keep the signal and drop the bill — often a major saving versus a per-GB SaaS contract.
Do you work with our existing tools?+
Yes. We integrate with what you already run — Prometheus, Grafana, Datadog, OpenTelemetry, and more — and fill the gaps rather than forcing a rip-and-replace, unless a change clearly pays for itself.
next step

See everything, own all of it.

A free 30-minute scoping call. You leave with a written fixed range and an honest read on your blind spots, alert noise, and observability cost. No deck, no drama.

or write to us — hello@obsium.io

Talk to an observability engineer