

74% of organizations say they have adopted DevOps. But when you look at what “adopted” means in practice, the picture gets less impressive. Most teams have automated their builds and set up a CI/CD pipeline. Some have automated testing. Very few have connected the full loop from planning through monitoring and back again (Spacelift: Top 47 DevOps Statistics 2026).
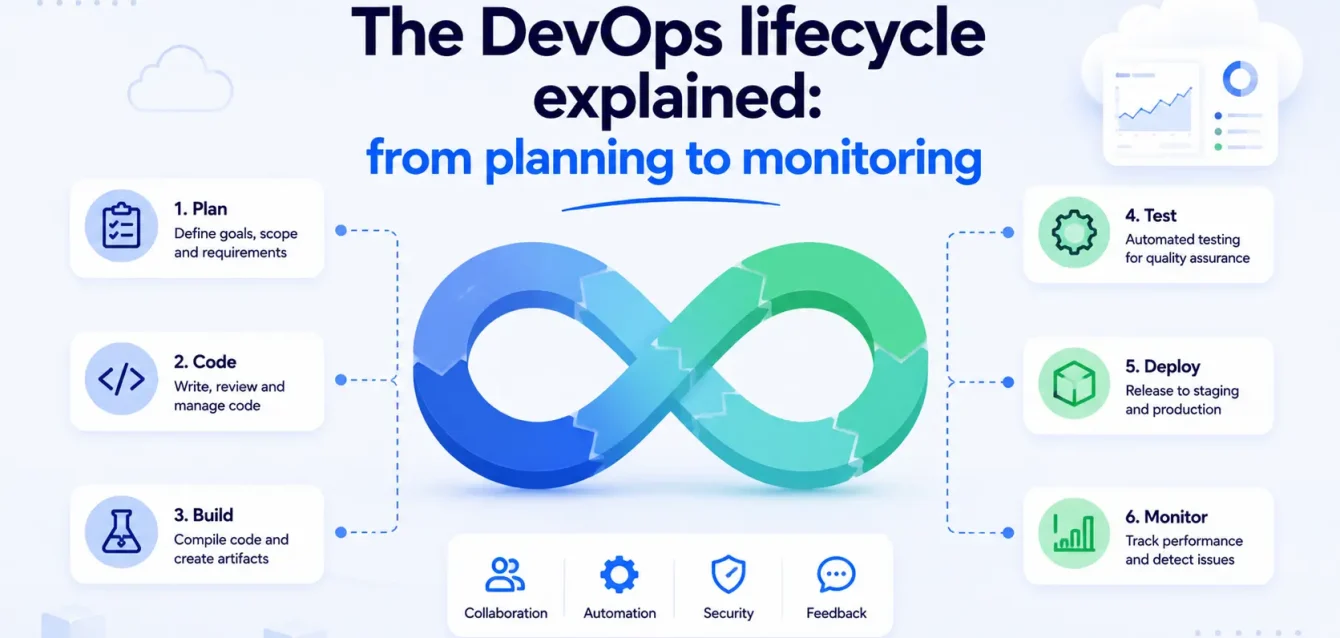
The DevOps lifecycle is usually drawn as a figure-eight or infinity loop with 7 stages. That visual is everywhere. What is less common is a clear explanation of what actually happens at each stage, what tools are involved, and where teams get stuck.
This post walks through each stage of the DevOps lifecycle, the DevOps principles that apply at each one, and what the loop looks like when it is working versus when it is not.
The 7 stages of the DevOps lifecycle
| Stage | What happens | Who is involved |
|---|---|---|
| Plan | Define what to build, prioritize work, set timelines | Product, engineering leads, stakeholders |
| Code | Write and review the software | Developers |
| Build | Compile code into deployable artifacts | CI system (automated) |
| Test | Verify the code works and does not break anything | CI system + QA (automated + manual) |
| Release | Package and approve for deployment | Release engineering, CI/CD pipeline |
| Deploy | Push the release to production | CD pipeline (automated) |
| Monitor | Watch production for errors, performance, and user impact | Operations, SRE, on-call engineers |
The loop is continuous. Monitoring feeds back into planning (we found a latency issue, let’s fix it next sprint). That feedback loop is what separates DevOps from the old waterfall model where software shipped and nobody looked at it again until customers complained.
Stage 1: Plan
This is where the team decides what to build next. In practice, planning combines:
- Product requirements (what users need)
- Technical debt items (what the system needs)
- Bug fixes and incident follow-ups (what broke last week)
- Infrastructure work (capacity, cost, security)
The DevOps principle that matters most at this stage: feedback loops. If your monitoring data does not feed into your planning process, you are planning blind. The teams that do this well pull incident reports, error trends, and performance data into sprint planning. The teams that do not end up building features on top of infrastructure that is quietly degrading.
Tools at this stage: Jira, Linear, GitHub Issues, Notion. The specific tool matters less than whether it is connected to your operational data.
Stage 2: Code
Developers write code, push it to a shared repository, and review each other’s work through pull requests.
Two DevOps principles run through this stage:
- Version control everything. Code, infrastructure definitions (Terraform, Helm charts), configuration, CI/CD pipeline definitions. If it is not in Git, it does not exist in DevOps.
- Small, frequent changes. Teams that merge small PRs multiple times a day have a change failure rate 7x lower than teams that batch large releases (Appfire: 58 DevOps Statistics Setting the Stage for 2026).
Where this stage breaks in practice: review bottlenecks. As covered in the DevOps metrics post, the average PR sits waiting for first review for 30+ hours. The code was written in 4 hours. It sits in a queue for a day and a half. This is the single biggest source of lead time in most organizations, and no CI/CD pipeline can fix it.
Stage 3: Build
When code is merged, the CI system compiles it into a deployable artifact: a Docker image, a binary, a package. This should be fully automated.
What the build stage produces:
- A versioned container image pushed to a registry
- Build metadata (commit hash, branch, timestamp, author)
- Dependency manifests (what libraries and versions are included)
This stage lives or dies on automation. If a human needs to run a build script manually, you do not have a DevOps build process. You have a script that someone remembers to run.
Most teams get this stage right. CI tools like GitHub Actions, GitLab CI, and Jenkins handle it well. The problems tend to show up in the next stage.
Stage 4: Test
Automated testing runs against every build. This is where most DevOps lifecycles have the biggest gap between what teams say they do and what they actually do.
The testing pyramid in theory:
| Test type | What it covers | Speed | Who writes them |
|---|---|---|---|
| Unit tests | Individual functions and methods | Fast (seconds) | Developers |
| Integration tests | How services interact with each other and with databases | Medium (minutes) | Developers + QA |
| End-to-end tests | Full user workflows across the system | Slow (minutes to hours) | QA + developers |
| Security scans | Known vulnerabilities, misconfigurations, exposed secrets | Medium | Automated (Trivy, Snyk, etc.) |
| Performance tests | Latency, throughput, resource usage under load | Slow | Performance engineering |
The testing pyramid in practice at most companies: some unit tests, maybe a few integration tests, and “we will test it in staging.” Automated testing reduces testing cycle time by up to 90%, but only 53% of teams use continuous integration for testing, and only 29% have deployed continuous deployment where tests gate the release automatically (Gitnux: 150+ DevOps Statistics 2026).
This is where shift left either happens or does not. Find problems early, when they are cheap to fix. A bug caught in unit tests costs minutes. The same bug caught in production costs hours of incident response plus whatever damage it did to users.
Stage 5: Release
The release stage is about deciding that a build is ready for production and packaging it for deployment. In some teams, this is a manual approval gate. In others, it is fully automated based on test results.
What a mature release process includes:
- All automated tests pass (no exceptions, no “we will fix it later”)
- Security scans show no critical or high vulnerabilities with known exploits
- The artifact is tagged with a release version
- Release notes or changelog are generated
- A rollback plan exists (usually: deploy the previous version)
The principle at work: continuous delivery. Every merge to main should produce an artifact that is deployable to production at any time. Whether you actually deploy it automatically (continuous deployment) or require a manual trigger (continuous delivery) depends on your risk tolerance and regulatory requirements.
Stage 6: Deploy
Push the release to production. In a Kubernetes environment, this usually means updating a deployment manifest to point at the new container image and letting the cluster roll it out.
Deployment strategies and when to use each:
| Strategy | How it works | Risk level | Best for |
|---|---|---|---|
| Rolling update | Replaces old pods with new ones gradually | Low | Most workloads, default in Kubernetes |
| Blue-green | Runs two identical environments, switches traffic to the new one | Low | Stateful services, zero-downtime requirements |
| Canary | Sends a small percentage of traffic to the new version first | Very low | High-traffic services, risky changes |
| Recreate | Kills all old pods, starts new ones | High (downtime) | Dev/staging environments, batch jobs |
The principle worth caring about here: automation with guardrails. Deploy automatically, but have automated rollback triggers. If error rates spike within 5 minutes of a deploy, roll back without waiting for a human to notice.
Teams that deploy to production multiple times per day (35% of respondents in the 2026 State of DevOps survey) consistently report lower change failure rates than teams that batch deployments weekly or monthly (Appfire: 58 DevOps Statistics Setting the Stage for 2026). Smaller deploys are easier to debug when something goes wrong.
Stage 7: Monitor
This is the stage that closes the DevOps lifecycle loop, and it is the one most teams underinvest in.
Monitoring means watching production systems for problems and collecting the data you need to diagnose them. In practice, that covers three types of telemetry:
- Metrics: Numeric measurements over time. CPU usage, request rates, error rates, latency percentiles. Collected by Prometheus, stored as time series, visualized in Grafana.
- Logs: Text records of events. Application errors, deploy events, access logs, audit trails. Collected by Loki or the ELK stack.
- Traces: Request-level paths through your system. Which services did this request hit, how long did each one take, where did the latency come from. Collected by Tempo or Jaeger, instrumented with OpenTelemetry.
The distinction that matters at this stage: monitoring versus observability. Monitoring tells you something is wrong. Observability tells you why. A dashboard that shows “error rate spiked at 3:14 PM” is monitoring. The ability to drill from that spike into the specific trace, log line, and code change that caused it is observability.
What to monitor at each layer
| Layer | What to watch | Why it matters |
|---|---|---|
| Infrastructure | CPU, memory, disk, network utilization per node | Detect resource exhaustion before it causes outages |
| Application | Error rates, latency (P50, P95, P99), request throughput per service | Catch degradation that users feel |
| Business | Conversion rates, checkout completions, API response times for partner integrations | Connect system health to revenue impact |
| Pipeline | Build times, test pass rates, deploy frequency, rollback count | Detect problems in the delivery process itself |
The monitoring-to-planning feedback loop
This is what makes the DevOps lifecycle a loop instead of a line. Monitoring data should feed directly into planning:
- A latency regression discovered in monitoring becomes a bug ticket in the next sprint
- A recurring alerting pattern becomes a reliability project
- Cost data from infrastructure monitoring becomes input for capacity planning
- Error trends inform where to invest in testing
Without this feedback loop, the DevOps lifecycle is really just “waterfall with a CI/CD pipeline.” You ship faster but you do not learn from production.
Where the lifecycle breaks down
Most teams have some version of each stage. The breakdowns happen at the boundaries between stages, where data and responsibility transfer from one group to another.
| Breakdown | What it looks like | What it costs |
|---|---|---|
| Monitoring does not feed back to planning | The team builds features while production issues pile up. Toil rises. Engineers burn out. | The 2026 State of SRE report found toil increased 30% in 2025, the first rise in five years. |
| Tests do not gate deploys | Broken code reaches production because “the tests were flaky” or “we will fix it after the release.” | Teams without automated test gates have 5x higher change failure rates. |
| No observability after deploy | The team deploys and moves on. Nobody watches error rates. Problems are found by users, not engineers. | Mean time to detect goes from minutes (with monitoring) to hours or days (without). |
| Manual handoffs between stages | A developer finishes code and waits for someone to review. QA manually picks up builds. Ops manually approves deploys. | Lead times measured in days instead of hours. |
The DevOps principles that tie it all together
The lifecycle stages are the what. The DevOps principles are the why. Five principles run through every stage:
- Automate everything repeatable. If a human does it more than twice, automate it. Builds, tests, deploys, rollbacks, alert routing.
- Shift left. Move quality checks (testing, security scanning, linting) as early in the lifecycle as possible.
- Measure what matters. Deployment frequency, lead time, change failure rate, recovery time. But also: cost per request, developer experience, toil ratio.
- Continuous feedback. Every stage generates data that should inform the stages around it. Monitoring feeds planning. Test results feed code review. Deploy outcomes feed release criteria.
- Shared ownership. The team that writes the code is responsible for running it in production. No throwing code over the wall to a separate ops team.
Where Obsium fits
If your team is shipping code but flying blind after deploy, book a free 30-minute observability consultation. No sales deck, just an engineer-to-engineer chat about your stack.