

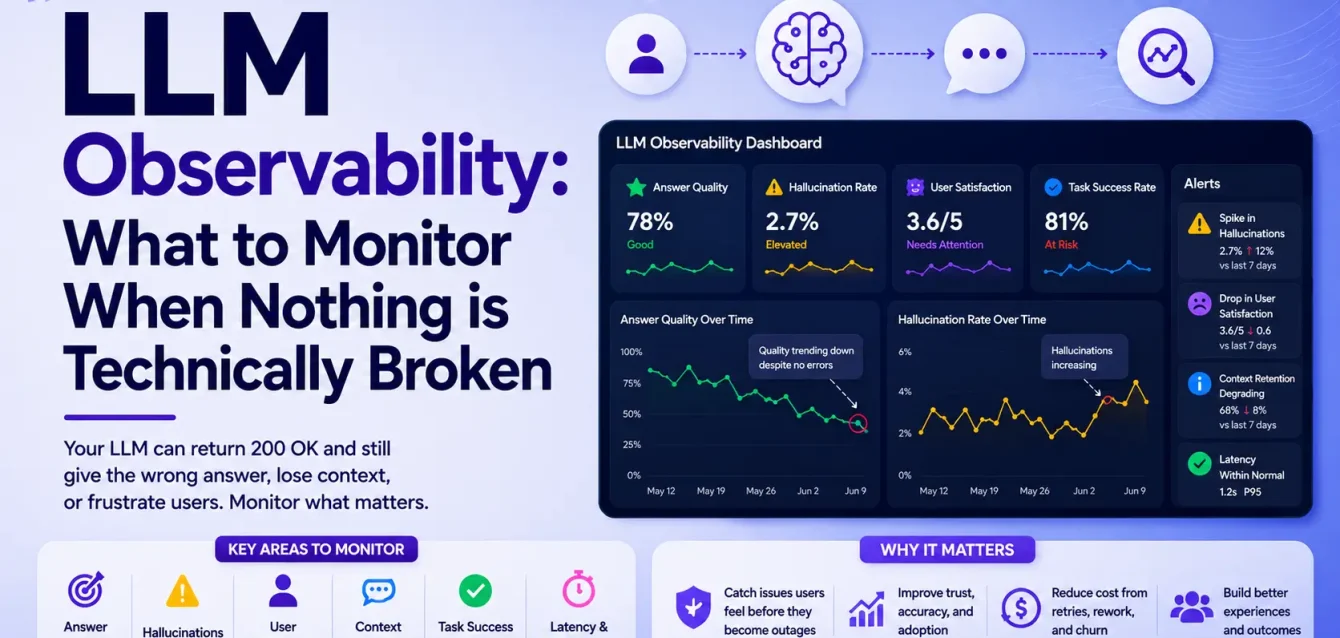
LLM observability is the practice of instrumenting AI applications so you can see what a model was asked, what it returned, what it cost, and whether the output was correct. It differs from traditional monitoring in one specific way: an LLM application can return a fast, valid, well-formatted response that is completely wrong, and no metric in a conventional APM tool will register a problem. Correctness has to be measured directly, using evaluators, because it cannot be inferred from status codes or latency.
Here’s what that looks like when it goes badly.
In July 2025, Deloitte Australia delivered a report to the Department of Employment and Workplace Relations under a contract worth AU$440,000. Within weeks, a University of Sydney academic found more than a dozen fabricated references attributed to his colleagues, alongside a quote invented from a federal court judgment.
Deloitte agreed to repay the final installment, and the revised version carried a new disclosure: Azure OpenAI had been used in drafting it (Accounting Times, CTV News).
From an infrastructure standpoint, nothing about that job was broken. The API returned 200s. Latency was normal. Token usage sat within budget. Every dashboard would have been green throughout.
Key takeaways
- 89% of teams have observability for their AI agents. Only 52.4% run evaluations, which is the part that catches wrong answers (LangChain, 2026).
- Traditional APM cannot detect hallucination, prompt injection, RAG decay, or prompt drift. None of them produce errors.
- OpenTelemetry’s GenAI semantic conventions are still in Development status as of July 2026. Nothing is marked Stable, and attribute names have changed six times since 2024.
- A viable open-source stack exists: OpenLLMetry for instrumentation, Langfuse or Phoenix for capture and evaluation, and the OpenTelemetry Collector you already run.
- Evaluation scores, not error rates, are what you should alert on.
Why does traditional observability miss LLM failures?
Because traditional tools assume determinism, and LLM applications aren’t deterministic. Charity Majors put the underlying problem plainly in 2023, and it hasn’t aged:
“LLMs are black boxes that produce nondeterministic outputs and cannot be debugged or tested using traditional software engineering techniques.” — Charity Majors, CTO of Honeycomb, LLMs Demand Observability-Driven Development
In a conventional system, a wrong response means a bug, a bad config, or a failed dependency. You can reproduce it and write a test for it. LLM applications break every one of those assumptions:
- The same input can produce different outputs on consecutive calls
- A confident, well-formatted answer can be entirely fabricated
- A one-line change to a system prompt can shift behavior across thousands of users
- None of it throws an exception
Majors also names the consequence that trips up most engineering teams:
“With software, you typically start with tests and graduate to production. With ML, you have to start with production to generate your tests.”
That inversion is why LLM observability isn’t an afterthought. It’s the mechanism by which you learn what your system does at all.
Most teams can see their agents. Far fewer can tell if they’re right.
LangChain’s State of Agent Engineering, published June 2026 from 1,340 responses, puts numbers on the gap.
| Finding | Figure |
|---|---|
| Have agents running in production | 57.3% |
| Have implemented some observability | 89% (94% among those in production) |
| Have detailed step and tool-call tracing | 62% (71.5% among those in production) |
| Run offline evaluations | 52.4% |
| Run online evaluations | 37.3% |
| Run no evaluations at all | 29.5% |
Observability adoption is close to universal. Evaluation is roughly half. Nearly nine in ten teams can watch their agent work, and only half can tell whether it worked.
The barriers data lines up. Quality was the top blocker to production for a third of respondents, ahead of latency at 20%. Among organizations over 10,000 employees, write-in answers named hallucinations and output consistency as the hardest part of ensuring quality. For enterprises above 2,000 people, security displaced latency as the second concern at 24.9%.
What are the main LLM failure modes?
Six recur, and none of them page you.
| Failure mode | What it looks like | Why APM misses it |
|---|---|---|
| Hallucination | A support bot invents a refund policy that doesn’t exist | 200 OK, normal latency, no exception |
| Prompt injection | Retrieved content or user input overrides your system prompt | Looks like an ordinary request |
| RAG degradation | Embeddings drift, the vector store goes stale, retrieval pulls near-misses | Quality decays gradually, no threshold crossed |
| Token cost explosion | A $0.02 prompt becomes $0.40 as context accumulates | Cost isn’t a per-request metric in APM |
| Latency tail | P50 fine, P99 at 45 seconds on long generations | Averages hide it, and users live in the tail |
| Prompt drift | Someone edits a prompt in a config file, nobody runs regressions | No deploy, no diff, no correlation to the complaint spike |
Prompt injection is not hypothetical. CVE-2025-53773 let an attacker reach remote code execution through GitHub Copilot by planting instructions in source files, web pages or GitHub issues. The payload wrote "chat.tools.autoApprove": true into the workspace’s .vscode/settings.json, switching off user confirmation prompts and handing the agent unrestricted shell access. Researcher Johann Rehberger reported it on 29 June 2025; Microsoft shipped the fix in the August 2025 Patch Tuesday (Embrace The Red).
Multi-step agents add an arithmetic problem. A step that’s 95% reliable gives you 0.95^10, or roughly 59% reliability across a ten-step workflow. Per-step accuracy that sounds acceptable compounds into a coin flip, and no individual span in that trace looks abnormal.
What should you monitor in an LLM application?
| Signal | Why it matters |
|---|---|
| Token usage per request | Cost control and context window management |
| Full input/output pairs | You cannot debug what you didn’t record |
| Prompt version | Correlating behavior changes to prompt changes |
| Model version | Same code behaves differently across model updates |
| Latency per stage | Retrieval, prompt assembly, inference, post-processing |
| Retrieval quality | Which chunks were pulled and how relevant they were |
| Evaluation scores | The closest available proxy for correctness |
| User feedback | Thumbs up/down, corrections, session abandons |
| Safety signals | PII leakage, injection attempts, toxicity |
| Cost per trace | The only number your CFO will ask about |
The one people skip is prompt version, and it costs the most later. Without it you cannot answer “what was the prompt at 3pm on Tuesday when quality dropped,” which is the only question that matters during an incident.
Are the OpenTelemetry GenAI semantic conventions stable yet?
No. As of 17 July 2026, no GenAI-specific span, event, metric or attribute is marked Stable. All of it sits in Development status.
This matters more than it sounds, because “OpenTelemetry GenAI semantic conventions” does not currently name one schema. The gen_ai.* surface was deprecated in the core semantic-conventions repository and moved out in v1.42.0 on 12 June 2026, and the dedicated GenAI repository has no tagged release yet. There is no versioned schema URL to pin against.
The attribute names have moved repeatedly:
| Release | Change |
|---|---|
| v1.27.0 (Aug 2024) | gen_ai.usage.prompt_tokens / completion_tokens became input_tokens / output_tokens |
| v1.37.0 (Aug 2025) | gen_ai.system became gen_ai.provider.name; per-message events replaced by structured message attributes |
| v1.38.0 (Oct 2025) | Added the gen_ai.evaluation.result event, so eval scores correlate to the operation they score |
| v1.40.0 (Feb 2026) | Retrieval spans, cache token attributes, gen_ai.agent.version |
| v1.41.0 (Apr 2026) | invoke_agent split into client and internal spans; reasoning tokens; streaming latency metrics |
| v1.42.0 (Jun 2026) | All GenAI material moved out of the core repository |
Frameworks emit several generations at once. John Hodge, who traced this in detail in July 2026, found a single Strands Agents application emitting the legacy gen_ai.system attribute with no gen_ai.provider.name, token usage duplicated under both attribute generations with identical values, and current-generation span names, all in one trace (full analysis).
“‘OpenTelemetry-compatible’ is not yet a sufficient schema contract for GenAI telemetry. Pin what you run, inspect what actually lands, normalize across generations, and date what you tested.” — John Hodge
And the design rule that follows:
“A Development-status external schema should never be your database contract.”
What this means for your build:
- Coalesce across attribute generations in every query, and never sum the pairs, because frameworks duplicate the same value under both names
- Pin framework, instrumentation, SDK and exporter versions together, since a minor framework bump can rename your attributes
- Keep your own internal telemetry model and map outward at export time
- Keep custom attributes out of the
gen_ai.*namespace, because a future revision can claim any name in it
None of this argues against OpenTelemetry. It remains the right interchange layer, and the gen_ai.evaluation.result event added in v1.38.0 is exactly the primitive this space needed. It argues against treating “we’re on OTel” as though the schema question is settled.
What are the best open-source LLM observability tools?
| Tool | Role | Worth knowing |
|---|---|---|
| OpenLLMetry (Traceloop) | GenAI instrumentation for common SDKs | Migration status varies by package; test the exact version you run |
| Langfuse | Prompt, completion, token and cost capture | Self-hostable, ingests OTLP directly |
| Phoenix (Arize) | Observability plus offline evaluation | Good if you want eval and production monitoring together |
| OpenTelemetry Collector | The pipeline | The same collector already handling your infrastructure telemetry |
That last row is the point. If you already run an OTel collector for your Kubernetes environment, LLM traces land in the same pipeline as everything else. No second observability system, no separate on-call surface, no separate bill.
The alternative is a hosted LLM observability vendor sitting on the fastest-changing layer of your stack, with your prompts and payloads leaving your environment. We deploy the self-hosted version for clients specifically because those payloads often contain data that legally cannot go to a third party.
How do you evaluate LLM output quality?
With evaluators: functions that score an output, run against production traffic. Three broad kinds:
- Rule-based. Did the output contain a phone number? Does it match a forbidden pattern? Cheap, deterministic, limited.
- Model-as-judge. Is this answer grounded in the retrieved context? Another model decides. Flexible, slower, pricier per call. Used by 53.3% of teams running evals.
- Human review. Still the most-used approach at 59.8%, and still the only one that catches genuinely novel failures.
Those figures come from the same LangChain survey, and the ratio matters: teams that evaluate seriously use both. Judge models give breadth, humans give depth, and traditional ML metrics like ROUGE and BLEU see little use because open-ended responses have many valid forms.
The working pattern: score production requests with lightweight evaluators, route low scores to human review, and save the failures as test cases. Production traces become your eval dataset, which is exactly the loop Majors described. It’s the closest thing an LLM application has to a test suite.
Five things teams consistently get wrong
- Logging completions but not prompts. Without the full assembled prompt, including retrieved context and system instructions, you’re debugging blind. Usually discovered mid-incident.
- Tracking cost at the account level. You learn the bill went up. You don’t learn which feature, customer, or prompt template caused it.
- Treating prompts as config rather than code. Prompts in a shared doc that five people can edit, with no version history and no review.
- Not sampling adversarial traffic. Injection attempts look like ordinary requests until you deliberately monitor for them.
- Shipping observability without evals. The 89%-versus-52% gap in the LangChain data is this mistake, measured.
A 30-day LLM observability rollout
| Week | Do this | You should end up with |
|---|---|---|
| 1 | Instrument with OpenLLMetry, deploy an OTel collector, stand up self-hosted Langfuse or Phoenix. Record exact versions of everything. | Full traces: prompt, completion, tokens, latency, cost |
| 2 | Build two or three evaluators (groundedness, PII detection, known failure regexes). Run in shadow mode. Emit scores as gen_ai.evaluation.result. | Tuned thresholds without breaking production |
| 3 | Move prompts into Git with review required. Tag each deploy with a prompt version that appears in traces. | The ability to answer “did quality change after that prompt update?” |
| 4 | Alert on evaluator scores, not error rates | Pages that fire on groundedness drops and cost-per-trace trends |
Week 3 gets skipped because it feels like process rather than engineering. It’s the one that pays off during the first bad week.
Where Obsium fits
Honest scope: we’re not an LLM tooling vendor. We build and operate the open-source observability stack underneath your Kubernetes environment, which is where most production LLM applications end up running anyway.
Grafana, Prometheus, Loki, Tempo and OpenTelemetry, deployed inside your infrastructure. We handle upgrades, scaling, alert tuning and dashboards, which is the 10-20 hours a month your team would otherwise spend on maintenance.
The relevance here is direct. The collector we deploy is the same one that accepts GenAI traces, so your LLM telemetry lands in the same backend as the rest of your platform. Prompts and completions stay in your environment. And when the conventions shift again, which the release history says they will, normalizing across attribute generations happens in a pipeline you control rather than in a vendor’s ingestion layer.
We’ve also moved teams off $200k+ Datadog contracts onto this stack, which matters here for an unglamorous reason: the monitoring budget for your AI features shouldn’t have to compete with the monitoring budget for everything else. If that’s your situation, Datadog alternatives for Kubernetes teams covers the options, how Datadog billing actually works explains where the money goes, and our Kubernetes observability guide covers the foundation this sits on.
If you want to talk through what that foundation looks like, book a free 30-minute observability consultation. No sales deck, just an engineer-to-engineer conversation about your stack.
Frequently asked questions
What is LLM observability?
LLM observability is the practice of instrumenting AI applications to capture prompts, completions, token usage, latency, cost, and evaluation scores, so teams can debug and measure output quality. Unlike traditional monitoring, it treats correctness as a signal to be measured rather than inferred from error rates.
What’s the difference between LLM observability and LLM monitoring?
Monitoring tracks predefined metrics such as latency, throughput and error rate. LLM observability adds the ability to inspect individual traces, including the exact prompt and retrieved context, and to score whether the output was correct. Monitoring tells you the system responded; observability tells you whether the response was any good.
Can Datadog or New Relic do LLM observability?
Both have added GenAI support, and Datadog began native OpenTelemetry GenAI support in v1.37. The practical constraints are cost, since per-request telemetry on LLM traffic is expensive under per-GB and per-host models, and data residency, since prompts and completions leave your environment.
Do I need OpenTelemetry for LLM observability?
Not strictly, but it’s the only vendor-neutral option, and it means LLM telemetry shares a pipeline with the rest of your infrastructure. Be aware that the GenAI conventions are still in Development status, so pin your versions and normalize across attribute generations.
How much does LLM observability cost?
Self-hosted, it’s the storage and compute the stack consumes plus the engineering time to run it. Hosted platforms typically price per trace, per span, or per seat, which scales with request volume rather than infrastructure size.