

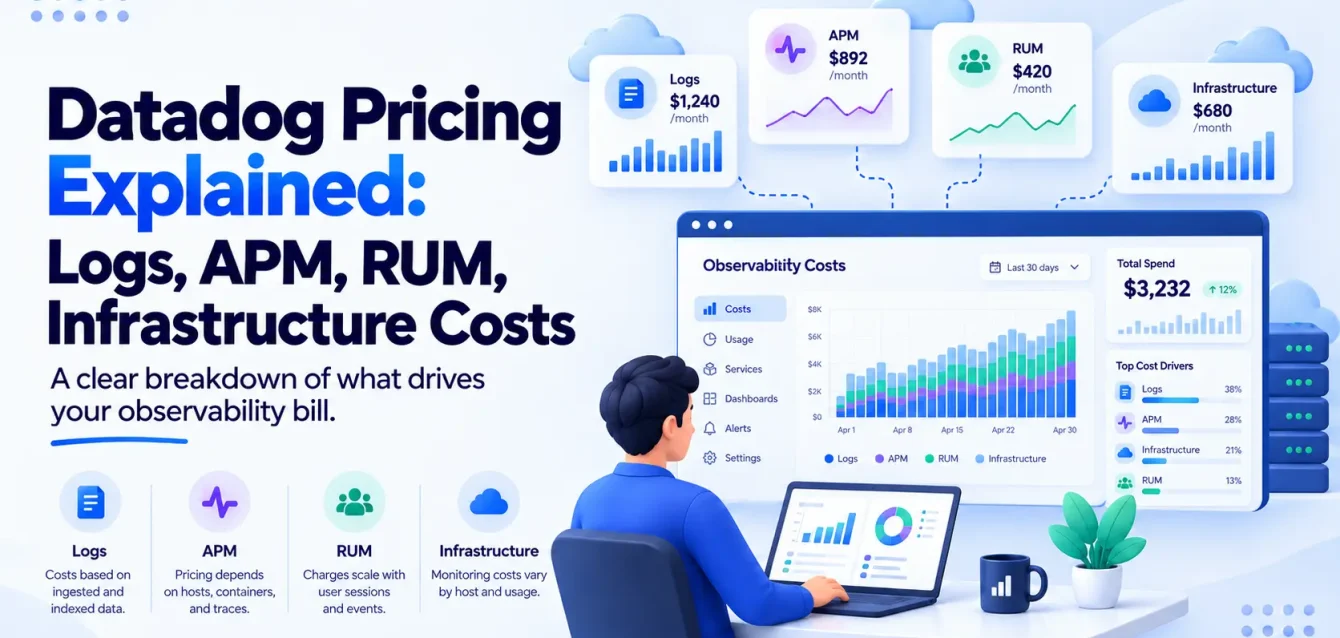
Datadog’s pricing page lists more than 20 products. Each one bills in a different unit: per host, per GB, per million spans, per thousand sessions, per committer. Nobody reads all of it before signing up. Most teams find out what a product actually costs the month they blow through the free allotment.
This is a plain reference for what each Datadog product charges, current as of September 2026. Not the framing on the pricing page. The numbers, the unit they’re billed in, and what a full stack adds up to for a real team.
If you’re trying to understand why your bill is 3x what you budgeted, that’s a mechanics question, covered in Datadog billing, how it actually works: high-watermark billing, host miscounting on Kubernetes, cardinality explosions. This page is the price list. Bookmark it. Datadog moves these numbers every few months, so treat anything here as a snapshot, not a contract.
Datadog pricing at a glance
| Product | Price | Billed per |
|---|---|---|
| Infrastructure Monitoring (Pro) | $15/month (annual), $18 on-demand | Host |
| Infrastructure Monitoring (Enterprise) | $23/month (annual), $27 on-demand | Host |
| APM | $31/month (annual), $48 on-demand | Host |
| APM Pro | $35/month (annual), $54 on-demand | Host |
| APM Enterprise | $40/month (annual), $60 on-demand | Host |
| Log ingestion | $0.10 | GB |
| Log indexing (standard, 15-day retention) | $1.70/month (annual), $2.55 on-demand | Million log events |
| Log Flex Storage | $0.05/month (annual), $0.075 on-demand | Million events stored |
| Custom metrics (overage) | $5/month | 100 metrics |
| Container overage | $0.002/hour (~$1.44/month) | Container |
| RUM (Application Monitoring) | ~$1.50/month | 1,000 sessions |
| Cloud Network Monitoring | ~$5/month (annual), $7.20 on-demand | Host |
| Synthetic API tests | $5/month (annual), $7.20 on-demand | 10,000 runs |
| Synthetic browser tests | $12/month (annual), $18 on-demand | 1,000 runs |
| CI Visibility (Test Optimization) | $8/month (annual), $12 on-demand | Committer |
| Cloud Cost Management | Not published | Quote only |
| On-Call | Not published | Quote only |
| LLM Observability | No standalone price, billed via APM spans | n/a |
Now the detail behind each row, and where the surprises live.
How Datadog actually bills you
Under the marketing names, every Datadog product bills against one of four units:
- Hosts. Infrastructure, APM, and Network Monitoring all count hosts, and Datadog counts the high watermark: your peak usage in a given month, not your average. Scale up for a week, and you pay the scaled-up rate for the whole month.
- Volume. Logs (GB ingested, events indexed) and RUM (sessions) bill on how much data you send, independent of hosts.
- Cardinality. Custom metrics bill per unique time series, which is the metric name combined with every tag value attached to it. This is the one that surprises experienced teams, and it’s covered in depth in the billing post.
- Seats. CI Visibility bills per committer. Some newer products (On-Call, Cloud Cost Management) are moving toward per-seat or usage-based models that Datadog hasn’t put public numbers on yet.
Nearly every product also has an annual vs. on-demand split, and the gap is real: on-demand rates run 30-50% higher across the board. If you’re testing Datadog before committing, budget for the on-demand number, not the one on the pricing page’s default toggle.
What counts as a “host”
This word does a lot of work on the pricing page, and it doesn’t mean what most people assume. A host is any entity running the Datadog Agent: a bare-metal server, a VM, a Kubernetes node, an EC2 instance. It is not the same as a service, an application, or a pod, though on a badly configured Kubernetes cluster it can end up counted that way by accident.
Serverless functions and Fargate tasks get counted differently again, usually against their own allotments rather than the standard host rate, so a team running a mixed fleet (some EC2, some Fargate, some Lambda) needs to check each category separately rather than assuming one host price covers everything.
Committed vs. on-demand: what the discount actually saves
Every price in this article marked “annual” assumes a committed contract, usually 12 months, paid up front or on a fixed schedule. On-demand pricing, the rate you pay with no commitment, runs 30-50% higher depending on the product. On a $15/host infrastructure line, that’s the difference between $15 and $18. On a 200-host fleet, committing annually instead of running on-demand saves roughly $7,200/year on infrastructure alone, before APM or logs are even in the picture.
The catch is that committing locks in a host count, and Datadog’s contracts are generally built around a projected usage tier. If your actual usage comes in under what you committed to, you’re still paying for the committed amount. If it comes in over, you pay overage on top of the commitment. Neither direction is forgiving, which is part of why so many teams end up talking to a Customer Success Manager mid-contract instead of just checking the pricing page.
Infrastructure Monitoring: the per-host baseline
This is what most people mean when they say “Datadog pricing.”
- Free: up to 5 hosts, 1-day retention.
- Pro: $15/host/month billed annually, $18 on-demand.
- Enterprise: $23/host/month billed annually, $27 on-demand.
This is also the unit that gets inflated on Kubernetes when the Agent is misconfigured to run per-pod instead of per-node. Fifty nodes should mean fifty billable hosts. A sidecar misconfiguration can turn that into five hundred.
There’s also a DevSecOps tier that bundles security features (Cloud Security Management, Cloud SIEM) into the infrastructure line: $22/host/month Pro billed annually ($27 on-demand), $34/host/month Enterprise ($41 on-demand). It’s worth checking whether your team is actually paying for this tier before assuming standard Infrastructure Pro or Enterprise is what’s on the invoice. Security bundling is an easy thing to inherit from a contract renewal without anyone re-checking whether it’s used.
Containers: the allotment that runs out on Kubernetes
Container monitoring isn’t its own line item until you exceed what’s bundled with your host plan.
- Included: 5 containers per host on Pro, 10 per host on Enterprise.
- Overage: $0.002 per container per hour, which works out to roughly $1.44 per container per month. There’s also a prepaid option around $1-$1.50 per container per month for teams that know they’ll exceed the allotment.
That allotment sounds reasonable until you do the Kubernetes math. A node running 15-20 pods, which is normal for a moderately dense cluster, blows past the Enterprise allotment of 10 by itself. A 50-node cluster averaging 15 pods per node has 750 containers. At 500 included (50 hosts x 10), that’s 250 extra containers, about $360/month just for the overage, before infrastructure, APM, or logs enter the picture.
APM: what tracing actually costs
- APM: $31/host/month billed annually, $48 on-demand.
- APM Pro: $35/host/month billed annually, $54 on-demand.
- APM Enterprise: $40/host/month billed annually, $60 on-demand.
Each APM host includes an allotment: 150 GB of ingested spans per month, and 1 million indexed spans per month at 15-day retention. Ingested spans are every trace your services generate. Indexed spans are the subset you can actually search and alert on.
Go past the included amounts, and you pay $0.10 per GB for additional ingested spans, and $1.70 per million for additional indexed spans (annual rate, $2.55 on-demand).
A single microservice under load can generate millions of spans a day. If your team runs distributed tracing across 30+ services, check your span volume before you assume the included allotment covers you. It usually doesn’t at scale.
One thing that catches teams off guard: APM hosts are billed separately from infrastructure hosts, even when they’re the same machine. If you instrument 30 of your 50 infrastructure hosts with APM, you’re paying for 50 infrastructure hosts and 30 APM hosts as two separate line items, not one blended rate.
Log management: where the real money goes
Log pricing has two charges stacked on top of each other, and this is consistently the biggest line item on a Datadog invoice.
Ingestion costs $0.10 per GB. This is the price of sending logs to Datadog at all, whether or not anyone ever queries them.
Indexing is the expensive part, because indexed logs are the ones you can search, alert on, and build dashboards from. Standard indexing runs $1.70 per million log events per month at 15-day retention (annual rate, $2.55 on-demand).
Datadog also offers Flex Storage at $0.05 per million events stored per month, a cheaper tier for logs you want to keep but rarely query, and a Flex Starter tier at $0.60 per million events stored.
Retention multiplies the standard indexing rate. Extending from 15 to 30 days is roughly 1.5x the cost. 60 days is closer to 2.5x. 90 days runs around 4x the base rate. A team logging 100 GB/day at 15-day retention is already looking at roughly $5,400/month in indexing alone before ingestion, infrastructure, or APM. Push that to 30-day retention, and it climbs toward $8,000/month.
If none of this math matches your invoice, the gap is almost always cardinality or log volume you didn’t know you were generating. We run a two-week Datadog cost audit that maps exactly where a bill is coming from before you touch a migration decision. Talk to an engineer about it.
Custom metrics: the cardinality tax
Custom metrics get $5 per 100 metrics per month once you exceed the included allotment (100 per host on Pro, 200 per host on Enterprise). The number that actually matters isn’t how many metrics you think you have.
It’s how many unique tag combinations each metric name generates. A metric with three tags carrying 10, 5, and 3 possible values each creates 150 distinct time series, and Datadog bills every one separately.
This is the single largest source of unplanned Datadog spend for teams running Kubernetes, and it deserves more than a paragraph. The full breakdown, including a worked example and how “Metrics without Limits” changes the math, is in Datadog billing, how it actually works.
RUM: what it costs to watch real users
Real User Monitoring bills per session rather than per host. Application Monitoring runs approximately $1.50 per 1,000 sessions per month on the annual rate. Session Replay, which records actual user screens rather than just performance metrics, is priced as an add-on on top of that base rate.
Sessions add up faster than expected once you instrument a consumer-facing app. A product with 500,000 monthly active users and a handful of sessions each per month can cross a few million billable sessions before anyone checks the dashboard.
Run the numbers: 500,000 MAU averaging 4 sessions/month is 2 million sessions, roughly $3,000/month on the base rate alone, before Session Replay is added on top. RUM pricing is volume-based like logs, so it scales with traffic, not infrastructure. That makes it one of the few Datadog products where a quiet backend team can safely ignore the bill and a growth-stage consumer product cannot.
Network monitoring: priced like infrastructure, sold separately
Cloud Network Monitoring runs approximately $5 per host per month on the annual rate, $7.20 on-demand, the same per-host structure as core infrastructure monitoring, just as a separate add-on. Network Device Monitoring, which covers on-prem switches, routers, and firewalls rather than cloud hosts, is typically quoted rather than listed with a fixed public rate, since pricing there depends on device count and polling frequency.
If your infrastructure bill already includes 200 hosts, adding network monitoring across the same fleet adds roughly $1,000/month on top, before you touch APM or logs.
The distinction matters because the two products answer different questions. NPM tells you about traffic flowing between your own services (which pod is talking to which, where the latency is). NDM tells you about the health of the physical or virtual network equipment underneath everything else. A Kubernetes-native team usually needs NPM far more than NDM, and it’s worth confirming which one a quote is actually for before signing off on it.
Cloud Cost Management: the one Datadog won’t put a number on
Cloud Cost Management is the product that ties your AWS, Azure, and GCP bills into Datadog’s dashboards for cost attribution and waste detection. It’s a genuinely useful product for teams already paying for Datadog everywhere else. It’s also the one product on this list with no published self-serve rate.
Datadog doesn’t list a per-host, per-GB, or percentage-of-spend number anywhere publicly. Every account we’ve seen with it running has it priced through a sales conversation, not a checkout page.
If you’re evaluating it, ask directly what unit it bills on for your account. Don’t assume it follows the same host-based logic as the rest of the platform, because as of this writing, Datadog hasn’t said it does.
Synthetics: API and browser test pricing
- API tests: $5 per 10,000 test runs per month on the annual rate, $7.20 on-demand.
- Browser tests: $12 per 1,000 test runs per month on the annual rate, $18 on-demand.
Browser tests cost roughly 24x more per run than API tests, which makes sense given they spin up an actual browser session rather than firing an HTTP request. The trap here is test frequency multiplied by locations.
A browser test running every 5 minutes from 3 geographic locations generates about 26,000 runs a month by itself. Multiply that across a suite of critical user flows and synthetics can become a meaningful line item even though each test looks cheap.
CI Visibility: per-committer pricing
Test Optimization (formerly branded as Code Coverage in some plans) runs $8 per committer per month on the annual rate, $12 on-demand. “Committer” means anyone who has pushed a commit in the billing period, not your total headcount, so the number tracks your active engineering team rather than the whole company.
This is one of the more predictable line items on the list because it scales with team size, not infrastructure or traffic. A 40-person engineering org where everyone commits regularly runs about $320/month on the annual rate.
Worth separating from this: Pipeline Visibility, which shows you CI/CD pipeline performance and failure analysis, is often bundled differently than Test Optimization, which is what the per-committer rate above covers. If your CI bill looks off, check which of the two products actually generated the charge before assuming the per-committer math is wrong.
LLM Observability: no separate line item
Datadog doesn’t publish a standalone price for LLM Observability, and that’s not an oversight; it’s the pricing model. LLM Observability rides on the same pipeline as APM: it bills through ingested and indexed spans, the same units covered in the APM section above. Every LLM call your application traces consumes ingested span volume the same way a database query does.
What that means in practice: if you’re instrumenting a high-traffic AI feature, the cost shows up as a jump in your APM span usage, not as a new product on the invoice. Teams that budget for LLM Observability as a separate line item are budgeting for the wrong thing. Budget for span volume instead, and expect it to be meaningfully higher than a typical microservice, since a single LLM call can generate a long chain of nested spans across retrieval, tool calls, and generation steps.
Third-party cost estimates for this, since Datadog itself won’t give you a number, put a small application (light traffic, a handful of AI features) around $300-800/month in incremental span cost, and an enterprise-scale deployment with agentic workflows and heavy tool-call chains anywhere from $8,000-15,000+/month. Those are estimates from teams reverse-engineering their own bills, not figures Datadog has confirmed, so treat them as a planning range rather than a quote.
On-Call: bundled features, unclear standalone pricing
Some incident management functionality ships inside the Enterprise infrastructure tier ($23/host/month annual). Datadog On-Call, the standalone paging and escalation product built to compete directly with PagerDuty and Opsgenie, doesn’t have a clean, consistently published per-user rate as of this writing.
If you’re comparing it against an existing on-call tool, get a quote for your seat count before assuming it’s a drop-in replacement at a predictable price. Don’t take a competitor’s blog post’s number as current. Datadog’s own pricing page is the only source worth trusting here, and even that changes.
What a real stack actually costs
Ballpark for a mid-sized Kubernetes team: 50 engineers, 200 infrastructure hosts, 120 of them APM-instrumented, moderate microservices architecture.
| Line item | Monthly cost |
|---|---|
| Infrastructure (200 hosts x $23, Enterprise) | $4,600 |
| APM (120 hosts x $31) | $3,720 |
| Log ingestion (100 GB/day x $0.10 x 30) | $300 |
| Log indexing (100 GB/day x $1.70 x 30) | $5,100 |
| Container overage (~250 extra containers) | $360 |
| Custom metrics overage (30,000 metrics) | $1,500 |
| Subtotal | $15,580/month (~$187,000/year) |
That’s five products. Add RUM on a consumer-facing app, Network Monitoring across the same fleet, a synthetics suite, and CI Visibility for the engineering team, and it’s not unusual to land between $17,000 and $20,000/month before anyone touches Cloud Cost Management, On-Call, or LLM Observability, the three products where Datadog isn’t showing its numbers.
For contrast, a smaller team looks very different. 10 engineers, 20 infrastructure hosts (Pro, not Enterprise), 15 APM-instrumented, light log volume:
| Line item | Monthly cost |
|---|---|
| Infrastructure (20 hosts x $15, Pro) | $300 |
| APM (15 hosts x $31) | $465 |
| Log ingestion (10 GB/day x $0.10 x 30) | $30 |
| Log indexing (10 GB/day x $1.70 x 30) | $510 |
| Custom metrics (within allotment) | $0 |
| Subtotal | $1,305/month (~$15,660/year) |
The scaling isn’t linear. A 10x increase in host count and log volume (20 to 200 hosts, 10 to 100 GB/day) turned a $1,300/month bill into a $15,500/month one, roughly 12x. That gap is the high-water mark effect and the Enterprise tier jump combined, and it’s the reason a pricing estimate done at pilot scale rarely survives contact with production.
Five numbers to ask Datadog for before you sign
Sales conversations tend to focus on the headline per-host rate. These are the numbers that actually predict what your bill looks like six months in:
- Your projected host count at 90 days, not day one. Autoscaling and Kubernetes node churn mean your real host count is usually higher than your launch-week count. Ask what a 20-30% increase does to the contract.
- Your average log volume per day, in GB, not events. Get this from your current logging stack before signing anything, and multiply by 30 to sanity-check the monthly ingestion and indexing estimate.
- Your custom metric cardinality, not your metric count. If nobody on your team has mapped this, the estimate you’re working from is a guess. See the billing post for how to actually measure it.
- Whether Cloud Cost Management, On-Call, or LLM Observability are in the quote, and on what unit. These three don’t have public rates, so whatever number lands in the contract should be spelled out clearly enough that you could recompute it yourself next year.
- What the on-demand rate looks like for every product in the deal. If the relationship ever needs to flex down (a layoff, a project getting cut, a budget freeze), the on-demand rate is what you fall back to, and it’s routinely 30-50% higher than what the annual proposal shows you.
FAQ
What is Datadog’s pricing model?
Datadog bills against four different units depending on the product: hosts (infrastructure, APM, network monitoring), data volume (logs, RUM sessions), metric cardinality (custom metrics), and seats (CI Visibility). Most products also carry an annual rate and a higher on-demand rate, and host-based products use high-watermark billing, meaning your peak usage for the month sets the price for the whole month.
What does Datadog actually cost for a mid-sized team?
For a 50-engineer team running 200 Kubernetes hosts with infrastructure monitoring, APM, and logs, expect somewhere around $180,000-$220,000 a year as a baseline, before RUM, synthetics, network monitoring, or any of the products Datadog prices by quote.
Is Datadog cheaper than New Relic or the open-source Grafana stack?
It depends heavily on your data volume and how much operational overhead you’re willing to take on. We ran the actual cost comparison, host by host, in Grafana vs. Datadog vs. New Relic.
Are there real alternatives if the bill is too high?
Yes, and which one makes sense depends on your scale and whether you have SRE capacity to run your own stack. We cover that in Datadog alternatives for Kubernetes teams.
Why doesn’t Datadog publish pricing for Cloud Cost Management, On-Call, or LLM Observability?
No official reason has been given. In practice, these are the newer products in the catalog, and Datadog appears to still be running them through direct sales rather than self-serve checkout. Get a quote for your specific usage before assuming they follow the same per-host logic as the rest of the platform.
Does Datadog have a free tier?
Yes, capped at 5 hosts with 1-day data retention on Infrastructure Monitoring. It’s enough to kick the tires on a small project, not enough to evaluate what a real production environment will cost. The gap between the free tier and a 200-host production bill is exactly why teams get caught off guard; the pricing they experience during evaluation looks nothing like the pricing they experience at scale.
How much does committing annually actually save over on-demand?
Roughly 30-50%, depending on the product. On a 200-host infrastructure fleet, that’s about $7,200/year saved on infrastructure monitoring alone by committing instead of running on-demand. The tradeoff is a locked-in host count for the contract term, so it only pays off if your usage forecast is reasonably accurate.
Where Obsium fits
We build and operate open-source observability stacks for Kubernetes teams. Grafana, Prometheus, Loki, Tempo, OpenTelemetry, deployed inside your own infrastructure. No per-host fee, no per-GB indexing charge, no high-watermark billing, and nothing priced by quote that you can’t see coming.
If the numbers on this page don’t match what’s on your invoice, that gap is worth understanding before you decide what to do about it. Book a free 30-minute observability consultation. No sales deck, just an engineer-to-engineer look at where the money is going.