

Here is the statistic that should bother anyone running infrastructure across more than one environment: 41% of IT leaders still find out about service interruptions through customer complaints, incident tickets, or manual checks (New Relic 2025 Observability Forecast, surveying 1,700 IT and engineering leaders).
Their monitoring didn’t tell them. A customer did.
The same research puts the median cost of a high-impact outage at $2 million per hour, and found 73% of organizations lack full-stack observability. Separately, 73% of organizations now run hybrid estates (Flexera 2026 State of the Cloud Report, based on 753 cloud decision-makers).
Those two figures describe the same problem from opposite ends: nearly everyone runs hybrid now, and very few can see across it.
This guide covers how visibility breaks down between environments, the one architectural decision that determines whether you can fix it, and what the fix costs. It’s aimed at the engineers who build this and the leaders who have to fund it.
What hybrid cloud management actually means
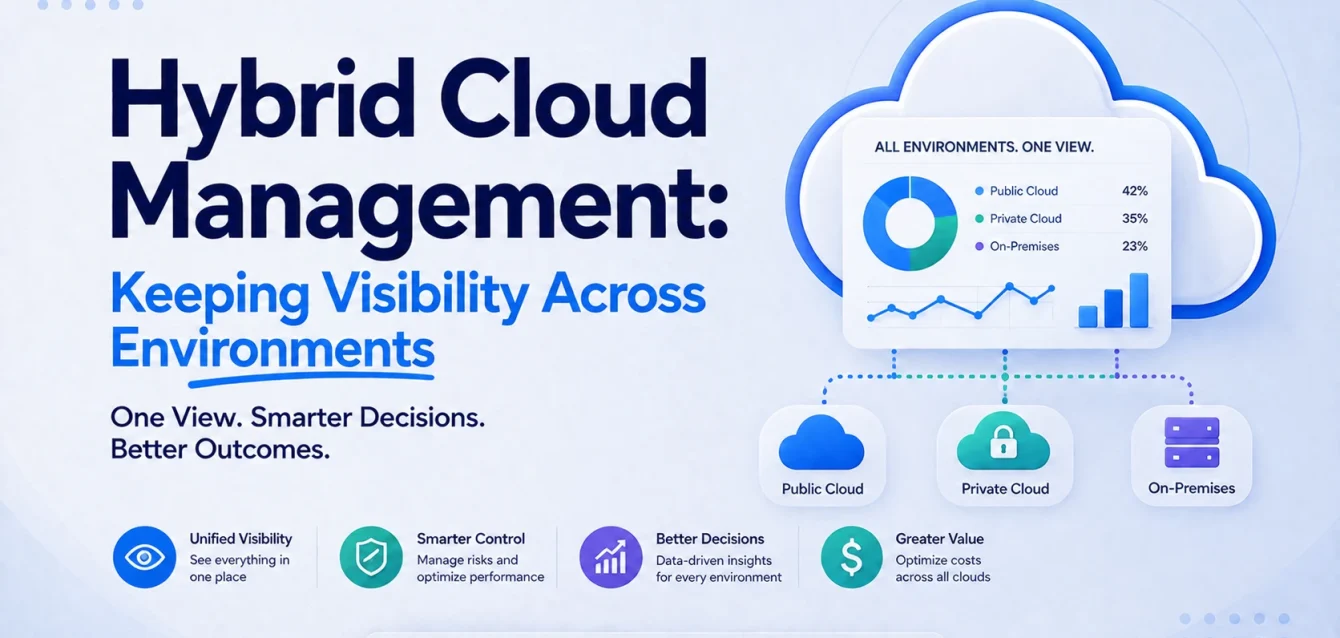
Hybrid cloud management is the practice of operating, governing, and observing workloads that span public cloud, private cloud, and on-premises infrastructure as a single system rather than as separate estates.
It has two dimensions that often get conflated:
- Control: provisioning, policy, and configuration across environments
- Visibility: knowing what’s running, how it’s behaving, what it costs, and whether it’s secure
Most organizations solve control first, because provisioning is a project with a clear finish line. Visibility gets solved incrementally, per environment, by different teams, which is exactly how you end up with six tools and no answers.
Hybrid vs multi-cloud vs distributed
These terms get used interchangeably and they describe different problems.
| Term | What it means | Primary visibility challenge |
|---|---|---|
| Hybrid cloud | Public cloud plus private cloud or on-premises | Bridging fundamentally different telemetry models (cloud APIs vs agents) |
| Multi-cloud | Two or more public cloud providers | Normalizing across providers that name the same things differently |
| Hybrid multi-cloud | Both of the above, the common enterprise reality | All of it at once |
| Distributed/edge | Workloads at remote sites or edge locations | Intermittent connectivity, local buffering, bandwidth limits |
Multi-cloud is usually accidental
Most multi-cloud estates were never designed. Flexera’s 2026 report notes that multi-cloud adoption continues to rise but often unintentionally, stemming from mergers, siloed application teams, or inherited architectures rather than deliberate strategy.
This matters for visibility work. You are rarely designing a clean hybrid architecture. You are usually reconciling three teams’ historical decisions, and the political problem is harder than the technical one.
Key insight: If your multi-cloud footprint came from an acquisition, your visibility gap is an org chart problem wearing a technical costume. The team running the acquired estate has their own tools, their own on-call, and no incentive to migrate. Budget for that conversation.
Why visibility breaks across environments
Each of these has a specific mechanism. Naming the challenge is easy; the mechanism is what tells you how to fix it.
Tool sprawl
Organizations average 4.4 observability tools, even after a 27% drop over two years, and 52% plan to consolidate onto unified platforms (New Relic). Research from EMA found 87% of network operations teams rely on multiple tools, often without meaningful integration (Network World).
The operational cost is what EMA calls swivel-chair troubleshooting: hopping between dashboards to manually reconstruct what happened during an incident. Every hop is a context switch, and every context switch is minutes added to MTTR while an outage runs at $2M/hour.
Tool sprawl is rarely a purchasing failure. It accumulates because each environment arrived with its own native tooling, and nobody was funded to unify them.
Data silos and the correlation problem
This is the one that actually blocks progress, and it survives tool consolidation.
The same workload has three identities. A service running across environments appears in your telemetry as:
i-0abc123in AWS CloudWatchprod-web-04.corp.internalin your on-prem monitoringweb-7d9f8b-xk2p1as a Kubernetes pod name
Nothing joins these automatically. You know they’re the same service. Your query engine does not.
The consequence is that you can buy a single dashboard and still fail to answer “show me every instance of the checkout service and its error rate.” You’ve unified the interface without unifying the underlying data model, which is the part that actually does the work.
The fix is semantic conventions, not tooling. OpenTelemetry’s semantic conventions define standard attribute names — service.name, deployment.environment, cloud.provider, host.name — so the same concept carries the same key everywhere. Applied consistently at collection time, correlation becomes a query rather than a research project.
Warning: Consolidating tools before standardizing metadata gets you an expensive single tool that still can’t correlate. Do the labeling work first. It’s unglamorous, it’s mostly a spreadsheet and a lot of pull requests, and it determines whether everything downstream works.
Inconsistent monitoring coverage
Cloud environments expose rich telemetry through provider APIs with no agent required. On-prem and legacy systems require agents, and agents don’t get installed everywhere.
Typical gap pattern:
- Modern cloud workloads: well instrumented
- Kubernetes: well instrumented, sometimes over-instrumented
- VMware/private cloud: infrastructure metrics only, no application visibility
- Legacy systems (mainframe, older Windows estates, appliances): whatever SNMP provides
- Network path between environments: frequently nobody’s job
That last one causes disproportionate pain. When traffic crosses a VPN or interconnect between environments, latency problems there look like application problems on both sides.
Security blind spots
Hybrid environments create three specific gaps:
- East-west traffic between environments is often unmonitored. Perimeter security assumes a perimeter; hybrid architectures have several.
- Identity spans environments while audit logging usually doesn’t. A federated identity can act in AWS, in your datacenter, and in Kubernetes, generating three disconnected audit trails.
- Inconsistent logging retention means the environment with the shortest retention determines how far back you can actually investigate.
Compliance and data residency
Regulatory requirements frequently prohibit exactly what makes visibility easy. If EU customer data can’t leave the EU, you cannot ship those logs to a US-hosted analytics backend, no matter how convenient that would be.
This is why the centralized-versus-federated decision below isn’t purely technical. Sometimes the architecture is chosen for you by a regulator.
Cost governance
Cloud billing and datacenter costs share no common denominator. Cloud gives you per-service, per-hour granularity. Your datacenter gives you a depreciation schedule and a power bill.
Comparing them requires building an allocation model — amortized hardware, facilities, and staff mapped onto something resembling per-workload cost. Most organizations never build it, so “should this workload run on-prem or in cloud” gets answered by intuition.
| Challenge | Root cause | What actually fixes it |
|---|---|---|
| Tool sprawl | Each environment arrived with native tooling | Consolidation, but only after metadata standards |
| Correlation failure | No shared identifiers across sources | OpenTelemetry semantic conventions |
| Coverage gaps | Agents not deployed on legacy/on-prem | Agent rollout plan, eBPF for hard cases |
| Security blind spots | Unmonitored east-west traffic, split audit trails | Unified audit pipeline, network flow logs |
| Compliance limits | Data residency prohibits centralization | Federated architecture with local retention |
| Cost opacity | No common cost denominator | Allocation model + FOCUS normalization |
The architecture decision: centralized or federated
This is the fork that determines everything downstream, and most content on hybrid cloud management skips it entirely.
Centralized: ship everything to one backend
All telemetry flows from every environment into a single store. One place to query, one retention policy, one bill.
Works when: total telemetry volume is moderate, no data residency constraints, and cross-environment correlation is your dominant use case.
Breaks when: volume grows. Egress charges and ingest pricing both scale linearly with data, and telemetry volume tends to grow faster than the infrastructure generating it.
Federated: query in place, aggregate selectively
Each environment keeps its own telemetry store. A query layer sits above them, fanning out queries and merging results. Only aggregates and long-retention data move.
Works when: you have residency requirements, high telemetry volume, or environments with constrained bandwidth.
Breaks when: you need fast ad-hoc correlation across environments. Fan-out queries are slower, and a single environment being unreachable degrades your whole view.
The tiered approach most mature teams land on
In practice, neither pure model survives contact with a real estate. What works is tiering by signal:
- Metrics: aggregate locally, ship downsampled rollups centrally. Cheap, and you rarely need per-second granularity from six months ago.
- Logs: keep full-fidelity locally with short retention, ship filtered subsets (errors, audit, security) centrally with long retention.
- Traces: sample aggressively at the edge, ship what survives. Tail-based sampling at a gateway keeps the interesting traces.
- Events: always ship centrally. Low volume, high value, and this is your correlation backbone.
| Centralized | Federated | Tiered | |
|---|---|---|---|
| Query latency | Fast | Slower (fan-out) | Fast for common, slower for deep |
| Egress cost | High | Low | Moderate |
| Data sovereignty | Difficult | Native fit | Manageable |
| Operational burden | Lower | Higher (N stores) | Highest initially |
| Failure mode | Single point of failure | Partial visibility loss | Graceful degradation |
| Correlation ability | Best | Weakest | Good |
| Best for | Mid-size, single jurisdiction | Regulated, high volume | Large enterprise |
Egress costs as a design constraint
This is the part vendor content omits, and it’s the reason many “single pane of glass” projects get quietly cancelled after the first full-quarter invoice.
A worked example. Take a mid-size estate generating 500 GB of logs per day on-premises, shipped to a cloud-hosted backend:
- 500 GB/day is roughly 15 TB/month leaving your datacenter
- Add ingest pricing on the destination, typically billed per GB
- Then retention pricing on stored volume
The transfer alone can run into thousands per month before you’ve paid for the observability platform itself. At scale this frequently exceeds the platform licence cost.
Design responses that work:
- Filter at the collector, not the backend. Debug logs from healthy services rarely earn their transit cost.
- Aggregate metrics locally before shipping. Ship the rollup, not every scrape.
- Sample traces at the edge with tail-based sampling so you keep errors and slow requests.
- Keep full-fidelity data local with short retention; ship only what needs long retention.
Production tip: Model your telemetry bill before you build the pipeline. Take current daily volume per environment, apply your provider’s egress rate and your backend’s ingest rate, then multiply by three. Telemetry volume grows with instrumentation coverage, and you will instrument more than you plan to.
Five questions that determine your architecture
- Do any environments have data residency or sovereignty requirements? → Federated or tiered.
- What is your total daily telemetry volume, and what does moving it cost? → Above a few TB/day, centralized gets expensive fast.
- How often do you genuinely need cross-environment correlation? → Daily suggests centralized or tiered; quarterly suggests federated is fine.
- Do you have the platform engineering capacity to run multiple telemetry stores? → If not, centralized despite the cost.
- What happens operationally when the link between environments drops? → If you need local visibility during a partition, federated.
Building the telemetry pipeline
OpenTelemetry is now the safe default
CNCF graduated OpenTelemetry in May 2026, with over 12,000 contributors from more than 2,800 companies, making it second only to Kubernetes in project velocity (CNCF).
“As organizations increasingly scale AI and cloud native workloads, real time observability is critical for operational success. OpenTelemetry’s graduation solidifies it as the essential, unified observability standard, providing the consistent visibility required to understand and oversee complex systems.” — Chris Aniszczyk, CTO, CNCF (CNCF announcement)
For hybrid specifically, the relevant property is that you instrument once and can change backends without re-instrumenting. In an estate where different environments historically came with different vendor agents, that’s the difference between a migration and a rewrite.
FICO’s chief architect described the hybrid case directly:
“Its vendor-agnostic architecture is a natural fit for our multi-cloud strategy, delivering consistent visibility across cloud and hybrid environments while consolidating tool sprawl and optimizing costs.” — Sean Baseman, Chief Architect, FICO Software (CNCF)
Collector topology
The pattern that scales across hybrid environments is two-tier:
ENVIRONMENT A (AWS)          ENVIRONMENT B (On-prem/VMware)
┌─────────────────┐          ┌─────────────────┐
│ App + agent     │          │ App + agent     │
│ OTel SDK        │          │ OTel SDK        │
└────────┬────────┘          └────────┬────────┘
         │                            │
    ┌────▼─────┐                 ┌────▼─────┐
    │ Collector│  (agent tier)   │ Collector│
    │ per node │                 │ per node │
    └────┬─────┘                 └────┬─────┘
         │                            │
    ┌────▼──────────┐            ┌────▼──────────┐
    │ Gateway       │            │ Gateway       │
    │ - filter      │            │ - filter      │
    │ - aggregate   │            │ - aggregate   │
    │ - sample      │            │ - sample      │
    │ - add labels  │            │ - add labels  │
    └────┬──────────┘            └────┬──────────┘
         │                            │
         └────────────┬───────────────┘
                      │  (filtered, labeled, sampled)
              ┌───────▼────────┐
              │ Central backend│
              │ + query layer  │
              └────────────────┘
The gateway tier is where the economics live. Filtering, sampling, and aggregation happen before data crosses an expensive network boundary. It’s also where you enforce labeling consistently, rather than relying on every application team to get it right.
A minimal gateway processor config enforcing environment labels:
processors:
  resource:
    attributes:
      - key: deployment.environment.name
        value: production
        action: upsert
      - key: cloud.provider
        value: aws
        action: upsert
  # Drop TRACE and DEBUG records before they cross the egress boundary
  filter/logs:
    error_mode: ignore
    log_conditions:
      - log.severity_number < SEVERITY_NUMBER_INFO
  # Keep traces that matter
  tail_sampling:
    policies:
      - name: errors
        type: status_code
        status_code: {status_codes: [ERROR]}
      - name: slow
        type: latency
        latency: {threshold_ms: 1000}
      - name: baseline
        type: probabilistic
        probabilistic: {sampling_percentage: 5}
What to collect at each layer
| Signal | Collect where | Retention | Hybrid-specific note |
|---|---|---|---|
| Metrics | Every environment | 13 months downsampled | Watch cardinality; per-pod labels explode fast |
| Logs | Every environment | 7–30 days full, 1 year filtered | Biggest egress cost driver |
| Traces | Application tier | 7–30 days sampled | Must propagate context across environment boundaries |
| Events | Control planes, audit logs | 1 year+ | Cheapest high-value signal; ship all of it |
| Profiles | Selected services | Days | Newer; OTel Profiles now in alpha |
Trace context propagation across environment boundaries is the piece teams most often get wrong. If a request enters through a cloud load balancer and terminates on an on-prem service, the trace only stitches together if W3C trace context headers survive every hop, including the proxies and gateways in between.
Cardinality discipline
Cardinality is where observability costs go to explode. Every unique combination of label values creates a separate time series.
Add a user_id label to a metric and you’ve created one series per user. Add pod_name in an environment with frequent redeployments and you generate new series continuously as pods cycle.
Practical rules:
- Never label with unbounded values: user IDs, request IDs, full URLs, pod names on high-churn workloads
- Keep label sets under roughly 10 dimensions per metric
- Put high-cardinality data in traces and logs, where it belongs, not metrics
- Alert on your own series count as a leading indicator of the next bill
Metadata standards: the highest-leverage work
If you do one thing from this article, do this. Define a required label set and enforce it at collection.
A workable minimum:
| Label | Example | Why |
|---|---|---|
service.name | checkout-api | The join key for everything |
deployment.environment.name | production | Separates prod from noise |
cloud.provider | aws / onprem / azure | Environment filtering |
service.owner | payments-team | Alert routing |
service.tier | critical | Prioritization |
One naming gotcha: deployment.environment was renamed to deployment.environment.name in newer semantic convention releases. The old key still works in most tooling but is deprecated, so use the new form on anything you’re instrumenting now rather than migrating it twice.
Enforce with admission policy in Kubernetes, collector processors elsewhere, and CI checks on infrastructure code. Retrofitting this later costs multiples of doing it upfront.
Most teams we work with don’t have a tooling problem. They have three telemetry pipelines built by three teams at three different times, and no shared vocabulary between them. Obsium builds unified observability across hybrid estates as an engineering engagement: standardizing metadata, designing the collector topology and cost model, and getting cost, security, and reliability telemetry onto one pipeline. If you’re staring at a consolidation project and want a second opinion on the architecture, book a free 30-minute consultation.
Monitoring across each environment type
Public cloud
Provider-native telemetry (CloudWatch, Azure Monitor, Google Cloud Operations) is comprehensive within its own boundary and doesn’t federate outward. Use it as a data source, exported through the OTel Collector, rather than as your analysis layer.
Watch for: metric delivery delays of several minutes on some services, which matters if you’re alerting on them, and API rate limits when polling at scale.
Private cloud and VMware
Infrastructure metrics are usually well covered. Application-level visibility usually isn’t.
The gap: hypervisor metrics tell you a VM is busy. They don’t tell you which application transaction is slow. Bridging this means agents inside guests, which is a rollout project with change-management overhead that cloud environments don’t have.
Kubernetes
Kubernetes generates more telemetry per workload than anything else in your estate, and it’s the environment most likely to be over-instrumented rather than under-instrumented.
We’ve covered this depth elsewhere rather than repeating it here — see the Kubernetes observability guide and unified observability for Kubernetes. For hybrid purposes the key point is that cluster-local Prometheus with remote-write of aggregates fits the tiered model well.
Traditional on-premises and legacy
The realistic goal for legacy systems is not parity. It’s enough signal to know when they’re the problem.
- SNMP and syslog into the OTel Collector via receivers
- Synthetic checks against the service endpoint, which works regardless of what’s inside
- eBPF where the kernel supports it, for network-level visibility without touching the application
Key insight: For systems nobody wants to touch, synthetic monitoring is underrated. You may not be able to instrument a 15-year-old application, but you can absolutely check every 30 seconds whether it responds correctly, and that catches most of what matters.
Cost visibility across hybrid environments
Cloud costs and datacenter costs don’t share a unit. Making them comparable takes deliberate work.
Normalize cloud costs first. The FOCUS specification standardizes cost and usage data across providers, so AWS, Azure, and GCP billing data lands in one schema instead of three.
Then build a datacenter allocation model:
- Total hardware cost, amortized over its useful life
- Plus facilities: power, cooling, space, network
- Plus the operations staff cost attributable to running it
- Divided by allocatable capacity, to get a per-unit cost
- Multiplied by each workload’s consumption
It’s an estimate. It’s still far better than the alternative, which is comparing a precise cloud number against nothing and concluding the cloud is expensive.
Then unit economics across environments. Cost per transaction, per customer, or per API call, calculated the same way regardless of where the workload runs. This is what makes placement decisions defensible.
Flexera found 49% of organizations now use unit economics, up from 40% the previous year. Their CTO framed the shift:
“FinOps has expanded from a cloud cost discipline into a strategic capability focused on technology value. Teams aren’t just looking at what cloud costs add up to, but they’re also looking at what cloud delivers, and they’re shaping decisions long before workloads hit the cloud.” — Brian Shannon, CTO, Flexera (2026 State of the Cloud Report)
For the metrics worth tracking, see our guide to FinOps best practices.
Security and compliance monitoring
Three requirements that are harder in hybrid than anywhere else.
Unified audit logging. Every environment produces audit logs in a different format with different retention. Normalize into one schema and one retention policy, driven by your longest compliance requirement rather than each platform’s default.
Identity as connective tissue. Federated identity means one principal acts across environments. That’s operationally good and forensically difficult, because the audit trail fragments across three systems. Correlating by identity requires that the principal identifier survives into every log, which frequently means custom mapping.
Evidence collection. Auditors ask for proof of control effectiveness across the whole estate. Teams that haven’t planned this spend weeks manually assembling screenshots. Teams that have, run a query.
Practical baseline:
- [ ] Audit logs from every environment into one pipeline
- [ ] Retention meeting your strictest regulatory requirement
- [ ] Identity correlation across environment boundaries
- [ ] East-west network flow visibility between environments
- [ ] Config drift detection against a defined baseline
- [ ] Evidence queries written and tested before the audit
Related: cloud vulnerability management covers prioritizing what these pipelines surface.
Automation and policy management
Visibility without enforcement produces reports nobody acts on.
Policy as code across environments. Open Policy Agent and Kyverno for Kubernetes, cloud-native policy services for cloud resources, Terraform or Crossplane checks for infrastructure code. The goal is one policy definition evaluated everywhere, not per-environment rules that drift apart.
Drift detection. Define the intended state, compare continuously, alert on divergence. In hybrid environments drift is usually worse on-prem, because change management is manual and someone always fixes something at 2am without updating the code.
Golden paths. Give teams a paved route that emits correct telemetry, labels, and policy compliance by default. Standardization achieved through defaults sticks. Standardization achieved through documentation does not.
AIOps: what works and what’s oversold
AI monitoring adoption rose from 42% in 2024 to 54% in 2025, the first year a majority of organizations deployed AI in observability (New Relic).
Here’s where the value actually shows up, and where it doesn’t:
| Capability | Reality | Verdict |
|---|---|---|
| Anomaly detection | Genuinely useful. Baselining normal behavior across heterogeneous environments is tedious manual work and models do it well. | Works |
| Alert correlation and noise reduction | Grouping related alerts into one incident measurably reduces fatigue. | Works |
| Predictive capacity | Reasonable for steady workloads, poor for spiky ones. | Partial |
| Automated root cause | Suggests plausible candidates. Frequently confident and wrong. Useful as a hint, dangerous as an answer. | Oversold |
| Auto-remediation | Fine for known, well-understood conditions. Risky beyond that. | Narrow |
The important caveat for hybrid specifically: AIOps amplifies your data quality in whichever direction it already points. Feed it telemetry where the same service has three names and no ownership labels, and it will confidently correlate unrelated things. The metadata work described earlier is the prerequisite, not an optimization.
Best practices checklist
Foundation
- [ ] Complete inventory of workloads across every environment
- [ ] Required metadata schema defined and documented
- [ ] Metadata enforced at collection, not requested from teams
- [ ] Ownership mapped for every service
- [ ] Architecture decision made deliberately (centralized/federated/tiered)
Pipeline
- [ ] OpenTelemetry as the standard instrumentation layer
- [ ] Two-tier collector topology with gateway filtering
- [ ] Telemetry cost modeled before build, monitored after
- [ ] Cardinality limits defined and alerted on
- [ ] Trace context propagation verified across environment boundaries
- [ ] Retention tiered by signal type and value
Operations
- [ ] Cross-environment correlation tested in a real incident scenario
- [ ] Alerts route to owning teams automatically
- [ ] Runbooks reference dashboards that actually exist
- [ ] Synthetic checks covering legacy systems that can’t be instrumented
- [ ] Network path between environments monitored
Governance
- [ ] Unified audit logging across all environments
- [ ] Policy as code evaluated consistently everywhere
- [ ] Cost allocation model covering cloud and datacenter
- [ ] Drift detection against defined baselines
- [ ] Quarterly review of what the pipeline costs versus delivers
Common mistakes
| Mistake | Why it fails | Do instead |
|---|---|---|
| Consolidating tools before standardizing metadata | One expensive tool that still can’t correlate | Labels first, tools second |
| Shipping all telemetry to one backend by default | Egress and ingest costs exceed the platform licence | Filter and aggregate at gateway tier |
| Treating “single pane of glass” as the goal | Unachievable; leads to endless dashboard projects | Target unified query and correlation |
| Separate pipelines for cost, security, reliability | Rebuilds the silos you’re trying to remove | One pipeline, multiple consumers |
| Instrumenting cloud, ignoring on-prem | The gap becomes the blind spot where incidents hide | Coverage plan spanning all environments |
| Unbounded metric labels | Cardinality explosion, surprise invoice | Cardinality budget, high-cardinality data in traces |
| Expecting AIOps to fix bad data | Confident, wrong correlations | Metadata quality first |
| No local visibility during network partition | Blind exactly when you need sight most | Local retention with graceful degradation |
| Ignoring the network path between environments | Interconnect latency looks like app latency on both sides | Monitor the path explicitly |
Hybrid cloud management tools compared
| Category | Open source | Commercial | When you need it |
|---|---|---|---|
| Instrumentation | OpenTelemetry | Vendor agents | Always; OTel unless you have a specific reason |
| Metrics store | Prometheus, Thanos, Mimir | Datadog, Chronosphere | Thanos/Mimir when federating across environments |
| Logs | Loki, OpenSearch | Splunk, Elastic, Datadog | Volume and retention drive the decision |
| Traces | Tempo, Jaeger | Datadog APM, Dynatrace | Once you have services calling services across environments |
| Visualization | Grafana | Vendor-native | Grafana federates across sources; most vendors don’t |
| Cost | OpenCost, Kubecost | Flexera, Apptio, CloudHealth | When hybrid cost allocation becomes a real question |
| Policy | OPA, Kyverno | CNAPP suites | As soon as you need consistent rules across environments |
| Pipeline | OTel Collector, Vector, Fluent Bit | Cribl | When egress cost forces filtering |
A reasonable open-source hybrid baseline: OTel Collector for the pipeline, Prometheus + Thanos for federated metrics, Loki for logs, Tempo for traces, Grafana for the query layer across all of them. It’s more operational work than a commercial platform and it federates natively across environments, which most commercial tools do not.
For a deeper vendor comparison, see Grafana vs Datadog vs New Relic, and if the driver is cost, how Datadog billing actually works.
Where hybrid cloud operations is heading
OpenTelemetry becomes the assumed default. Post-graduation, new instrumentation that isn’t OTel-based increasingly needs justification.
eBPF closes coverage gaps. Kernel-level instrumentation gives network and syscall visibility without touching application code, which is valuable exactly where you can’t modify the application.
Data sovereignty pushes toward federation. As residency rules tighten across jurisdictions, architectures that require centralizing all telemetry become legally harder. Federated query is the structural answer.
AI workloads create a new visibility problem. GPU utilization, token consumption, inference latency, and cost-per-task are the new signals, and they cut across environments as teams place AI workloads based on data gravity and hardware availability.
Cost, security, and reliability telemetry converge. They already share collectors and metadata. Organizations still running three separate pipelines are paying three times for overlapping data.
Where Obsium fits
Hybrid visibility is an engineering program rather than a procurement decision, and the work is mostly unglamorous: agreeing on labels, designing collector topology, modeling costs, and migrating off tools people have grown attached to. Plan for quarters.
Obsium does this work with engineering teams — standardizing telemetry across cloud, private cloud, Kubernetes, and on-prem, designing pipelines that don’t produce surprise invoices, and building the correlation layer that makes incidents solvable in one place.
If you’re planning a consolidation or you’ve just had an incident nobody could diagnose across environments, book a free 30-minute consultation. No sales deck. An engineer will look at your architecture and tell you where the visibility actually breaks.
Conclusion
Running hybrid is normal. Seeing across it is not, and the 41% of leaders learning about outages from customer complaints is what that gap looks like in practice.
What to take away:
- Fix metadata before tools. Consolidation without standard labels buys an expensive tool that still can’t correlate.
- Choose centralized or federated deliberately. Egress cost, sovereignty, and query patterns decide it, not vendor preference.
- Model the telemetry bill before building. Observability spend surprises more teams than any other line item.
- OpenTelemetry is the safe default now that it’s CNCF-graduated. Instrument once, stay portable.
- “Single pane of glass” is the wrong target. Unified query and correlation is the achievable one.
- One pipeline for cost, security, and reliability. Three pipelines rebuild the silos you set out to remove.
- AIOps amplifies data quality in whichever direction it points. Do the metadata work first.
Next steps, in order: inventory what runs where, define and enforce a required label set, model your telemetry costs, make the architecture decision explicitly, then consolidate tools. That sequence matters. Most failed programs run it backwards, starting with a tool purchase.
FAQs
What is hybrid cloud management?
The practice of operating, governing, and observing workloads that span public cloud, private cloud, and on-premises infrastructure as one system. It covers both control (provisioning, policy, configuration) and visibility (monitoring, cost, security posture).
What is the difference between hybrid cloud and multi-cloud?
Hybrid cloud combines public cloud with private cloud or on-premises infrastructure. Multi-cloud means using two or more public cloud providers. Most enterprises run hybrid multi-cloud, and Flexera’s research suggests the multi-cloud part is often unintentional, arriving through mergers or siloed teams.
Why is visibility difficult in hybrid cloud environments?
Each environment produces telemetry in a different format with different identifiers for the same workload. Cloud platforms expose API-based telemetry; on-prem systems need agents. Without standardized metadata, you can view all the data and still be unable to correlate it.
What is unified observability?
The ability to query and correlate telemetry across all environments through a consistent data model. It doesn’t require one tool. It requires shared semantic conventions so a service means the same thing everywhere.
How do you monitor workloads across multiple clouds?
Standardize instrumentation with OpenTelemetry, deploy collectors in each environment, enforce consistent resource attributes at the gateway tier, and choose centralized or federated aggregation based on volume, cost, and residency constraints.
What is a single pane of glass in cloud management?
The idea of one interface showing everything across all environments. In practice it’s usually oversold. The achievable and more useful goal is unified query and correlation, where you can ask one question and get an answer spanning environments, even if operational work still happens in several places.
How do you control costs in a hybrid cloud environment?
Normalize cloud costs using FOCUS, build an allocation model for datacenter costs covering amortized hardware, facilities, and staff, then compare using unit economics like cost per transaction. Separately, control telemetry costs through gateway filtering and sampling, since observability spend is often a top-five cloud line item.
How does OpenTelemetry help with multi-cloud observability?
It provides one set of APIs, SDKs, and semantic conventions across every environment, so you instrument once and can switch analysis backends without re-instrumenting. In hybrid estates where different environments came with different vendor agents, this is what makes consolidation feasible.
What is the difference between centralized and federated observability?
Centralized ships all telemetry to one backend: better correlation, higher egress cost, difficult under data residency rules. Federated keeps telemetry local and queries across stores: cheaper, sovereignty-friendly, slower for ad-hoc cross-environment queries. Most large estates end up tiered, centralizing high-value low-volume signals and keeping bulk data local.
How do you ensure compliance across hybrid cloud environments?
Unify audit logging into one schema and one retention policy set by your strictest requirement, correlate identity across environment boundaries, enforce policy as code consistently, and write and test your evidence queries before an audit rather than during one.