

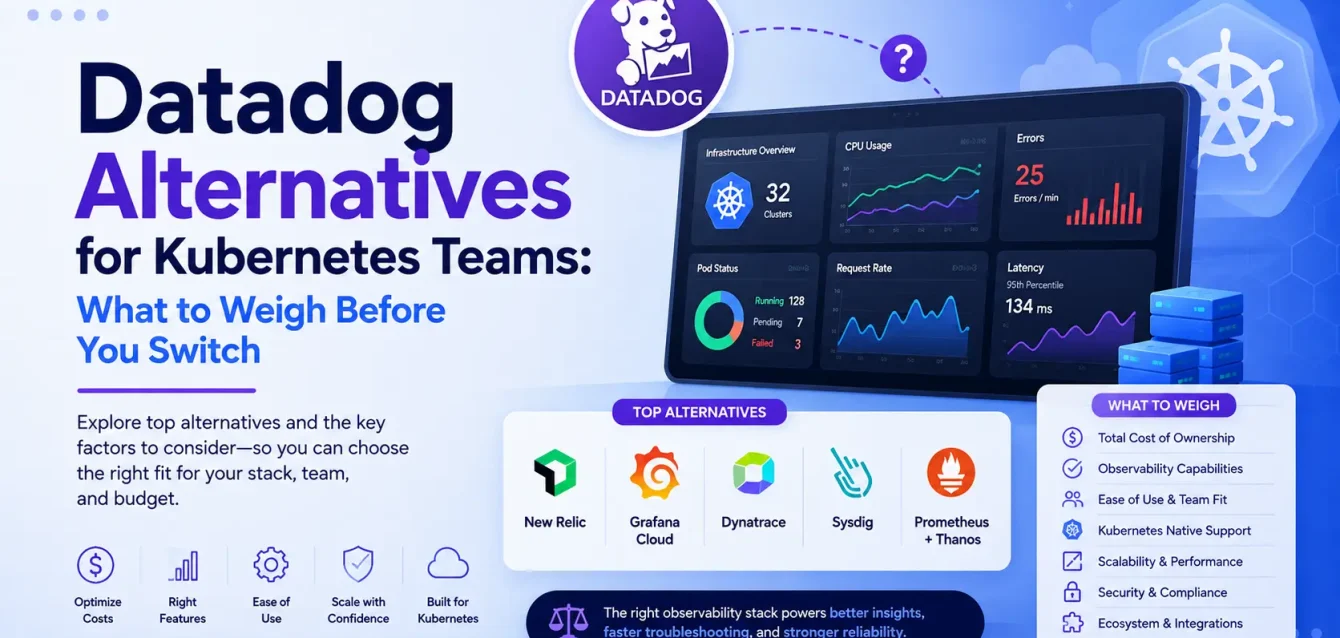
Almost nobody starts looking for a Datadog alternative because they hate Datadog.
They start because a renewal quote landed and it was 40% higher than last year, and nobody on the team can explain exactly why. Or because a cardinality spike from one badly-labeled metric cost more than a junior engineer’s monthly salary.
Or because the CFO asked what observability costs per engineer and the answer was embarrassing enough that “let’s look at options” became a Q3 goal.
That’s a fine reason to go shopping. It’s also a terrible reason to pick a replacement, because “cheaper than Datadog” describes roughly forty products, and about eight of them will cost you more than Datadog within eighteen months once you count the engineering time.
So before the vendor demos start: what are you actually trying to get away from?
Three problems that all look like “Datadog is too expensive”
We’ve done this migration with enough Kubernetes teams to notice that the same complaint hides three very different situations. They need different answers.
| What you’re feeling | What it actually is | What fixes it |
|---|---|---|
| Bill is high, but you can explain it and it scales sensibly | A procurement and hygiene problem | Renegotiate, cut retention, fix cardinality. Don’t migrate. |
| Bill moves in ways you can’t forecast within 50% | A pricing-model problem | Migrate, or move to a vendor that prices on shaped telemetry |
| Bill is fine, but the dependency makes you nervous | A lock-in problem | Re-instrument on OpenTelemetry, whatever backend you keep |
The first one is by far the most common, and it’s the one where migration disappoints people. You’re spending $18k a month, you know roughly why, and the number tracks your infrastructure.
That’s not an architecture failure. We wrote up the mechanics of how Datadog billing actually works, and most teams find 30-40% of that spend is genuinely wasted before they change a single vendor.
The second one is the real case for switching. Autoscaling events blow up the high-watermark calculation. A new service ships with default Kubernetes labels on every metric, quietly tripling your custom metric count.
You cannot discipline your way out of per-host billing on an elastic cluster, because the thing generating the cost is the thing you deliberately built.
The third is quieter and usually surfaces during a renewal negotiation, when someone realizes the leverage is entirely one-sided. Custom instrumentation, a proprietary agent, dashboards that exist nowhere else, five years of institutional knowledge in a query language you can’t take with you.
Be honest about which one you have. Teams that migrate for problem one usually end up unhappy, having traded a known bill for an unknown operational burden and saved less than they hoped.
The actual landscape
Organized by what each option is genuinely good at rather than by vendor marketing category. Short version first.
| Category | Examples | Best for | Skip if |
|---|---|---|---|
| Self-hosted open source | Prometheus, Grafana, Loki, Tempo | Scale, cost control, zero lock-in | You have no observability owner |
| ClickHouse-backed all-in-one | SigNoz, HyperDX, Uptrace | OTel-native teams drowning in log volume | You rely on many vendor integrations |
| Cost-control commercial | Chronosphere, Coralogix, Last9 | Unpredictable bills, no ops appetite | Lock-in is your main concern |
| Full-stack commercial | Grafana Cloud, New Relic, Dynatrace, Elastic | Wanting a like-for-like swap | You’d be buying the same problem again |
| Cloud-native | CloudWatch, Azure Monitor, GCP Ops | Small single-cloud teams | You’re multi-cloud or hybrid |
| Specialist | Honeycomb | Debugging genuinely novel failures | You need it to replace everything |
Self-hosted open source: Prometheus, Grafana, Loki, Tempo
The default answer for Kubernetes teams, and for good reason. Prometheus is already running in most clusters whether you planned it or not. Grafana reads from everything. Loki does logs with an index-light design that’s cheap by construction. Tempo does traces. OpenTelemetry feeds all of it.
What you get:
- No per-host fee, no per-GB indexing charge, no billing surprise when the autoscaler does its job
- Costs that are storage plus compute, both of which you already know how to forecast
- Full portability, because every piece of it runs anywhere
What you pay instead is people. Someone has to own Prometheus retention and remote write. Someone has to size Loki’s chunk store and work out why queries over 30 days out.
Someone has to be on call when the observability stack itself is down. This is real work, and pretending otherwise is how teams end up back on a SaaS platform eighteen months later having burned the migration budget twice.
Rough guide from our own client work:
| Cluster size | Does self-hosting pay off? |
|---|---|
| Under ~50 nodes | Rarely. Operational overhead outweighs the license savings. |
| 50-150 nodes | Depends entirely on whether you have SRE capacity or can rent it. |
| Over ~150 nodes with real log volume | Usually yes, and the gap widens every year. |
ClickHouse-backed all-in-one: SigNoz, HyperDX, Uptrace
A newer category worth understanding. These take the “one UI for logs, metrics and traces” idea that made Datadog pleasant, and rebuild it on ClickHouse with OpenTelemetry as the only ingestion path. Open source core, paid cloud option, self-host if you prefer.
The appeal is correlated telemetry without assembling four projects yourself, and columnar storage that makes high-volume logs genuinely cheap to query. The tradeoff is ecosystem maturity: fewer integrations, smaller community, and noticeably less Stack Overflow when something breaks at 2 am.
Alerting and RBAC in this category are improving quickly but were the common complaints when we last evaluated them seriously.
Good fit if you’re OTel-native already and your pain is mostly log volume. Less good if you depend on a long tail of vendor integrations.
Cost-control-first commercial: Chronosphere, Coralogix, Last9
These exist specifically because of the problem you have. Rather than charging per host or per indexed GB, they sit in front of your telemetry and let you shape it:
- Aggregate metrics before they hit storage
- Route logs to cheap tiers unless somebody actually queries them
- Drop cardinality you’re not using, deliberately rather than accidentally
Chronosphere in particular built its whole pitch around metric cardinality control, which is exactly the failure mode that makes Kubernetes bills explode. Coralogix separates “monitor this” from “store this” from “index this” and prices each differently.
You’re still buying a commercial platform with a commercial renewal cycle, so this doesn’t solve lock-in. It does solve unpredictability without you running storage infrastructure. For teams with problem two and no appetite for operational ownership, this is often the honest answer even though it’s less fun than open source.
Full-stack commercial replacements: Grafana Cloud, New Relic, Dynatrace, Elastic
Swapping one SaaS for another. Sometimes correct, often not, because you can end up with the same class of problem wearing a different hat.
| Platform | The case for it | The catch |
|---|---|---|
| Grafana Cloud | Same stack you’d self-host, run by the people who wrote it. Exit stays open both ways. | Still a vendor bill, still a renewal conversation |
| New Relic | Generous at low volume, simple per-GB-plus-per-user model | Kubernetes is a log firehose and you’re now paying by the liter |
| Dynatrace | Excellent automated dependency mapping, enterprise everything | Priced accordingly |
| Elastic | Strong if you already run and understand Elasticsearch | Operating Elasticsearch at observability scale is its own specialization |
Grafana Cloud is the interesting one for Kubernetes teams, mostly because the migration path stays open in both directions. That optionality is worth real money at the next renewal, and it’s the only entry here where deciding to self-host later isn’t a second migration.
We covered the head-to-head in more depth in Grafana vs Datadog vs New Relic.
Cloud-native: CloudWatch, Azure Monitor, Google Cloud Operations
Underrated for single-cloud teams, and genuinely bad for everyone else.
If you’re all-in on AWS, the combination of CloudWatch, Amazon Managed Prometheus and Amazon Managed Grafana covers a surprising amount of ground with no vendor relationship to manage and billing that lands on an invoice you’re already reconciling.
The querying experience is worse than anything else on this list and cross-account setups get tedious, but for a team of eight running one EKS cluster it can be entirely sufficient.
Stop considering it the moment you’re multi-cloud or hybrid. You’ll end up with two monitoring systems and no correlated view, which is worse than either one alone.
The specialist: Honeycomb
Not a Datadog replacement. A replacement for the specific part of Datadog you use when production is broken, and nobody knows why.
Honeycomb’s event-based model handles high-cardinality queries that would bankrupt you elsewhere, and its debugging workflow beats anything else here for genuinely novel failures. Teams sometimes run it alongside a cheaper general-purpose stack: commodity telemetry goes to the cheap thing, and the services that page you at 3 am go to Honeycomb. That’s a legitimate architecture, not a compromise.
Compare the pricing models, not the prices
Published prices change monthly, and every vendor discounts. What doesn’t change is the shape of the model, and the shape is what determines whether your bill tracks your infrastructure or ambushes you.
| Approach | You pay for | Kubernetes behavior | Ops burden |
|---|---|---|---|
| Datadog | Hosts, indexed GB, custom metric series | Bad. Nodes, pods and labels all multiply | Very low |
| Self-hosted OSS | Storage, compute, your engineers | Neutral. Scales with actual data | High |
| ClickHouse-based | Storage and compute, or seats on cloud | Good for log volume | Medium |
| Cost-control commercial | Shaped and retained telemetry | Good, that’s the point | Low |
| Grafana Cloud | Active series, ingested GB, users | Reasonable | Low |
| New Relic | Ingested GB and users | Poor at high log volume | Low |
| Cloud-native | Metrics, logs, API calls | Fine, within one cloud | Low |
Watch the third column. Per-host pricing on an elastic cluster is a bet against your own autoscaler. Per-GB pricing is a bet against your own logging practices. Neither bet goes well by default.
What nobody puts in the migration plan
This is the part that gets skipped, and it’s the part that decides whether the project succeeds.
| Hidden cost | Why it happens | What to budget |
|---|---|---|
| Parallel running | You can’t switch off the system on-call trusts until the new one catches a real incident | 3-6 months of double spend, in the business case not a footnote |
| Alert parity | Years of accumulated monitors, no full inventory, some muted, a few load-bearing | A proper audit. You’ll delete more than you migrate. |
| Cardinality | High cardinality is expensive by physics, not by pricing policy | Fix instrumentation first, or your “cheap” stack needs 3x the storage you planned |
| Query fluency | Engineers who write Datadog queries half-asleep will be slower in PromQL | A quarter of degraded incident response, roughly |
| Ownership | The person who built it moves teams and nobody knows how retention works | A named owner and a runbook, or don’t start |
The cardinality one deserves emphasis, because it’s the trap. Teams migrate without touching instrumentation, discover their new stack costs far more than modeled, and conclude the tooling was oversold.
Then they fix cardinality, and find their old Datadog bill would have dropped enough to make the migration unnecessary. Annoying, but useful information, and much cheaper to learn in that order.
The ownership one is the slowest failure. The migration succeeds technically, the champion moves on, and eighteen months later the whole thing is quietly rotting. We wrote about that pattern in why most observability programs fail after tool deployment, and it applies double to migrations.
Six-Step Observability Migration Roadmap
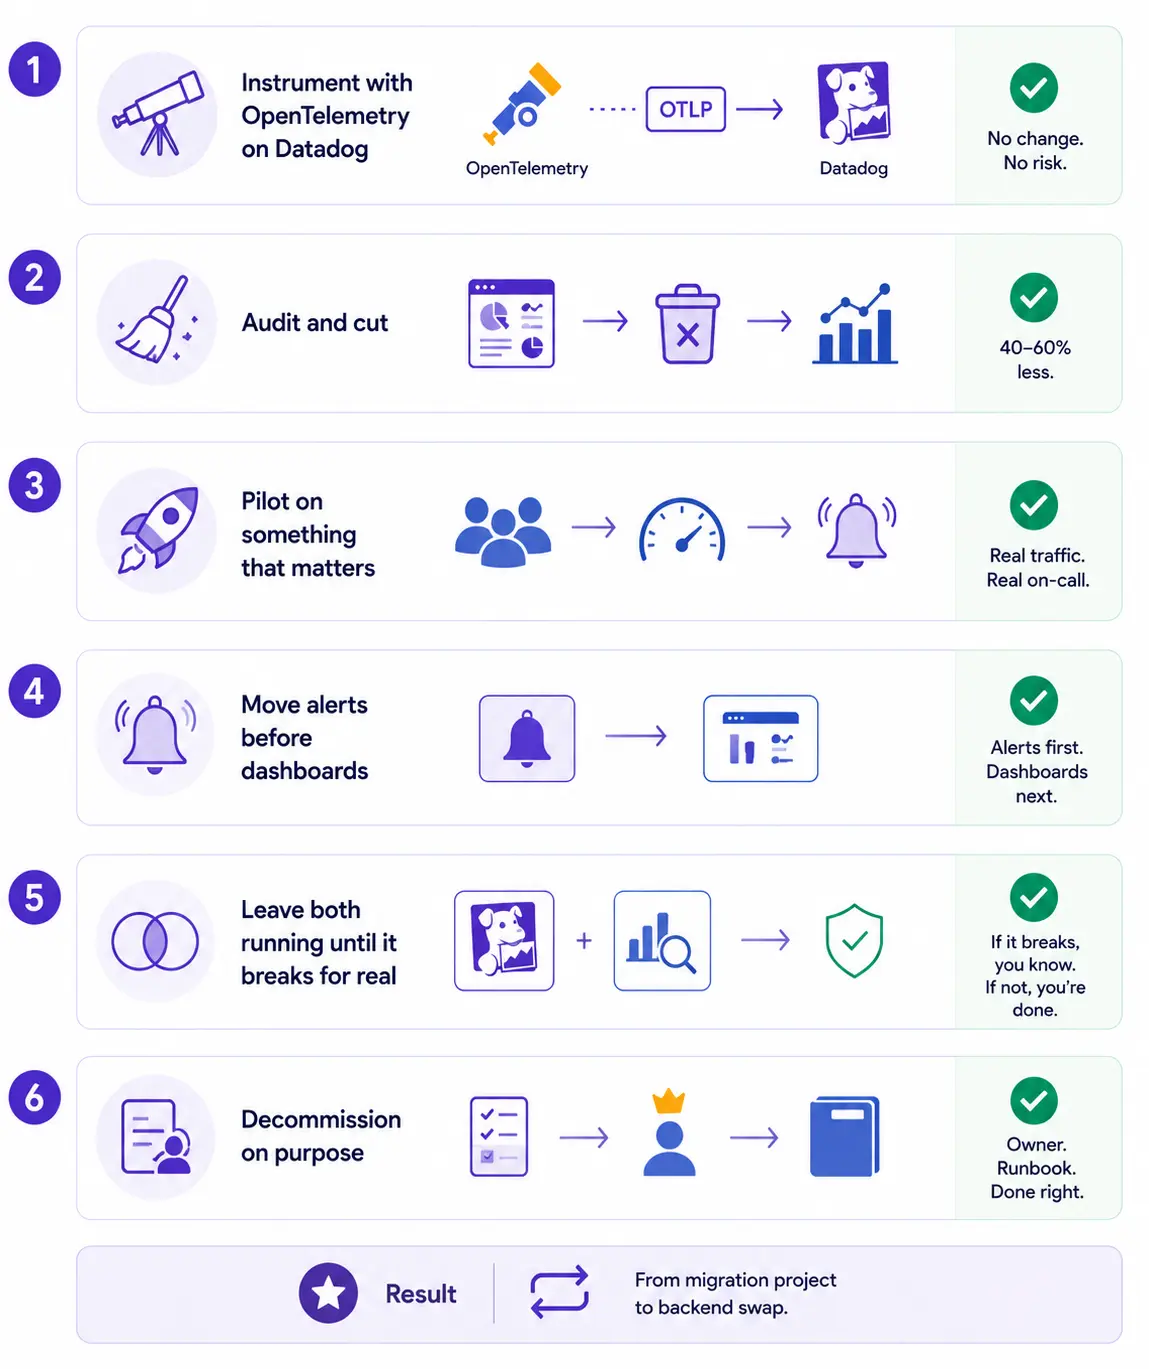
- Instrument with OpenTelemetry while you’re still on Datadog.
Datadog accepts OTLP, so this changes nothing a user can see and carries no rollback risk. It also quietly converts the whole project from a migration into a backend swap. Do this even if you never switch. - Audit and cut.
Kill the unused dashboards, the dead monitors, the metric labels nobody has queried in a year. Whatever survives is your real requirement, and in our experience it comes in 40-60% under current usage. - Pilot on something that matters.
Real traffic, real on-call rotation, people who will complain loudly if alerting gets worse. Piloting on a service nobody depends on teaches you nothing except that the installer works. - Move alerts before dashboards. People assume the opposite because dashboards are the visible thing. But alerts are what wake somebody at 3 am, and dashboards are just what they open afterward.
- Leave both running until something breaks for real. A quarter-end, a traffic peak, an actual incident. If the new stack surfaced the problem as fast as the old one, you’re finished. If it didn’t, you found out cheaply.
- Decommission on purpose, with a named owner and a runbook that exists. Migrations that end with “we’ll document it later” are the ones we get called about two years on.
When you should just stay on Datadog
Worth saying plainly, because most content in this category has an obvious incentive not to.
| Stay if | Because |
|---|---|
| You’re under ~50 hosts with modest log volume | Datadog is cost-competitive there and the simplicity is worth real money |
| Nobody owns observability | A self-hosted stack without an owner degrades. Not whether, only how fast. |
| Your bill is high from bad hygiene, not bad model | Retention defaults and unaudited cardinality follow you to the new platform |
| You’re mid-reliability-crisis | Changing instruments while flying. Fix reliability first. |
The strongest case for switching is narrower than the internet suggests: you’re at meaningful scale, your bill moves in ways you can’t forecast, you have or can rent the capability to operate a stack, and you’d rather spend that money on engineering than licensing.
If that’s you, the economics are compelling and they compound every year. If it isn’t, renegotiate and go fix your cardinality.
Where Obsium fits
We build and run open-source observability for Kubernetes teams. Prometheus, Grafana, Loki, Tempo and OpenTelemetry, deployed inside your infrastructure, operated by us or handed over to you with documentation that survives the person who wrote it.
Most conversations start the same way: someone has a renewal coming and wants a straight answer on whether switching is worth it. Sometimes we tell people to stay where they are. That’s a fine outcome.
If a renewal is coming up, book a free 30-minute consultation. No deck. An engineer will look at your actual usage and tell you what we’d do.